

Hello Aspirants. Welcome to Online Quantitative Aptitude section in AffairsCloud.com. Here we are creating question sample From Data Intrepretation that is important for all the competitive exams. We have included Some questions that are repeatedly asked in exams !!
Questions Penned by Yogit
Q(1 –5): Study the following charts and answer the following questions:
The following bar graph shows the ratio of the export to import of two companies A and B over the period 2002-07.
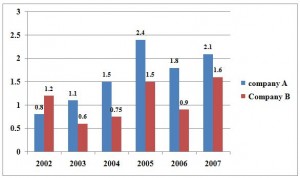
- In how many years is the import is more than the export of company A?
a) None
b) one
c) two
d) three
e) More than threeAnswer – b) one
Explanation :
In 2002, E/I = 0.8 - If the total number of import of company A for the years 2005 and 2006 was Rs 50 crore, what was the total export for the same years?
a) 25
b) 30
c) 34
d) can’t be determined
e) None of theseAnswer – d) can’t be determined
Explanation :
For 2005, export/import = 2.4 and for 2006, export/import = 1.8
50 = E1/2.4 + E2/1.8, so we can’t determine - In which of the following years, the difference between the export and import of company A is minimum.
a) 2002
b) 2004
c) 2005
d) can’t be determined
e) None of theseAnswer – d) can’t be determined
Explanation :
Either export or import is not given for all years - If the difference the import and export for company B for the year 2004 was Rs. 50 crore. Find the value of export for the same year?
a) 100 crore
b) 120 crore
c) 150 crore
d) 180 crore
e) None of theseAnswer – c) 150 crore
Explanation :
E/I = 0.75, so I = (4/3)*E
I – E = 50, 4E/3 – E = 50, So export = 150 crore - Had the export for company A in 2005 is decreased by 25% and import is increased by 25% for the same year, what would be the new ratio of export to import?
a) 1.22
b) 1.46
c) 1.44
d) 1.52
e) None of theseAnswer – c) 1.44
Explanation :
Export/import = 2.4
So export = 12x and import = 5x
New ratio = 12x*(75/100) : 5x*(125/100) = 36/25 = 1.44
Q(6 – 10) Study the following graph to answer the given questions: –
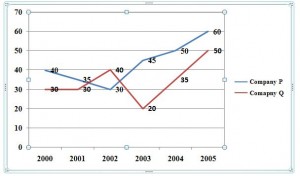
Percent profit earned by two companies over the given years.
% profit = [(income –expenditure)/(expenditure)]*100
- If the expenditure of company P in 2000 was Rs. 200 crores, what was its income?
a) 200
b) 220
c) 260
d) 280
e) None of theseAnswer – d) 280
Explanation :
40/100 = (I – 200)/200, I = 280 - If the income of company Q in 2004 was Rs. 600 crores, what was its expenditure?
a) 444
b) 440
c) 480
d) 484
e) None of theseAnswer – a) 444
Explanation :
35/100 = (600 – E)/E
E = 444.44 crore - If the incomes of two companies are equal in 2001, what was the ratio of their expenditures?
a) 25:27
b) 27:26
c) 26:27
d) 30:31
e) None of theseAnswer – c) 26:27
Explanation :
35/100 = (I – E1)/E2 and 30/100 = (I – E2)/E2 - What is the percent increase in the percent profit for company Q from year 2000 to 2002?
a) 20%
b) 25%
c) 33.33%
d) 46.67%
e) None of theseAnswer – c) 33.33%
Explanation :
% profit in 2000 = 30%
% profit in 2002 = 40%
% increase = (10/30)*100 = 33.33% - If the expenditure of both the companies are equal in 2005, find the ratio of their income?
a) 14:15
b) 16:15
c) 15:16
d) 15:14
e) None of theseAnswer – b) 16:15
Explanation :
for P, 60/100 = (I – E)/E, Ip = (8/5)*E
for Q, 50/100 = (I -E)/E, Iq = (3/2)*E
so ratio Ip: Iq = 16:15
Note: Dear Readers if you have any doubt in any chapter in Quants you can ask here. We will clear your doubts
