

Hello Aspirants. Welcome to Online Quantitative Aptitude section in AffairsCloud.com. Here we are creating question sample From Data Intrepretation that is important for IBPS,SBI exam,SSC exam, Railways Exam,FCI exam and other competitive exams. We have included Some questions that are repeatedly asked in exams !!
I . Sales of mobile phone in the year 2005 and 2006 by the six branches A, B, C, D, E and F. Study the graph and answer the following questions.
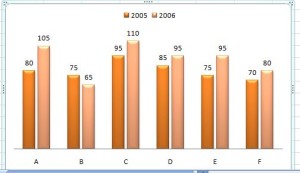
- Find the ratio of total sales of B in both years to the total sales of branch D in both years.
A)9:7
B)7:9
C)5:3
D)3:5Answer – B) 7 : 9
Explanation :
B = 75+65 = 140
D =85+95 = 180
B:D = 140:180 = 7:9 - What is the average number of mobile phones sold in 2005 ?
A)60
B)65
C)70
D)80Answer – D) 80
Explanation :
Average = (80+75+95+85+75+70)/6 = 80 - Which branch sold the maximum number of mobile phones in both years ?
A)A
B)B
C)C
D)DAnswer -C) C
Explanation :
A = 80 + 105 = 185
B = 75 + 65 = 140
C = 95 + 110 =205
D = 85 + 95 =180
E = 75 + 95 =170
F = 70 + 80 =150 - What is the difference between the number of mobile phones sold in 2005 by branch A and 2006 by branch D ?
A)5
B)10
C)15
D)20Answer – C) 15
Explanation :
2005, A = 80
2006, D = 95
Diff = 95 – 80 = 15 - Number of mobile phones sold by branch C is what percentage of the Total Number of mobile phones sold in 2006 ?
A)10%
B)20%
C)25%
D)30%Answer -B) 20%
Explanation :
2006, C = 110
2006 Total = 105+65+110+95+95+80 = 550
% = (110/550)×100 = 20%
II . Study the graph and answer the following questions. Data related to the number of plants planted by 2 villages X and Y.
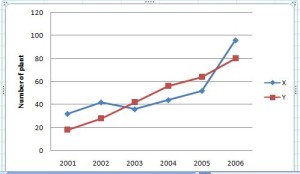
2001 2002 2003 2004 2005 2006
32 42 36 44 52 96 X
18 28 42 56 64 80 Y
- Number of plants planted by village X increased by what percentage from 2001 to 2005 ?
A)62.24%
B)62.5%
C)65.2%
D)54.5%Answer -B) 62.5%
Explanation :
% = [(52 -32)/32]×100 = 62.5% - What is the average number of plants planted by village Y during 2001,2003,2005 and 2006 ?
A)48
B)50
C)51
D)54Answer -C) 51
Explanation :
Avg = (18+42+64+80)/4 = 204/4 =51 - What was the total number of plants planted by village Y in 2002 and 2006 ?
A)102
B)104
C)106
D)108Answer -D) 108
Explanation :
Y total = 28+80 = 108 - Find the ratio of total number of plants planted by X in 2001 and 2002 to the total number of plants planted by Y in 2003 and 2004 ?
13:19
37:49
25:43
7:9Answer -B) 37:49
Explanation :
X 2001,2002 =32+42 = 74
Y 203, 2004 = 42+56 = 98
X:Y = 74:98 = 37:49 - Which village plant more number of plants in 2003 and what is the difference between number of plants planted by both villages in 2003 ?
A)Y,6
B)X,6
C)X,7
D)Y,5Answer -A) Y,6
Explanation :
X = 36
Y = 42
Diff = 42 – 36 =6
