

Hello Aspirants. Welcome to Online Quantitative Aptitude section in AffairsCloud.com. Here we are creating question sample From Data Intrepretation that is important for IBPS,SBI exam,SSC exam, Railways Exam,FCI exam and other competitive exams. We have included Some questions that are repeatedly asked in exams !!
Click here to View Quantitative Aptitude Quiz Page
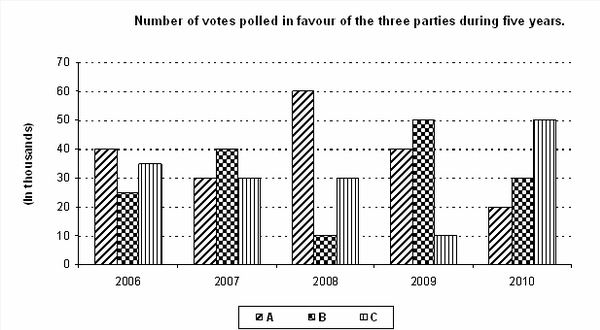
Directions for questions 46 to 50: Study the following graph and answer the questions given below:
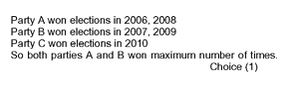
- Choose the party that won the elections maximum number of times.
1 : A and B
2 : A and C
3 : B and C
4 : A
5 : B1 : A and B
- In which year there was a maximum % increase in votes polled for party B When compared to the previous years?
1 : 2009
2 : 2010
3 : 2007
4 : Cannot be determined
5 : None of these1 : 2009
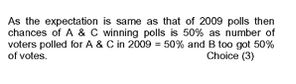
- Parties A and C, being allies, got merged in 2011 elections. If the expectations in 2011 were same as 2009 polls, what could be the chance of A and C winning?
1 : 60%
2 : 30%
3 : 50%
4 : 40%
5 : None of these3 : 50%
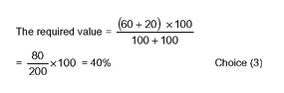
- The total number of votes polled in favour of A in 2008 and 2010 is what percentage of the total number of votes polled in favour of all the three parties in the same years?
1 : 22%
2 : 31%
3 : 40%
4 : 43%
5 : None of these3 : 40%
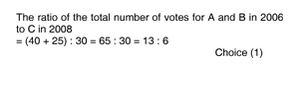
- What is the ratio of the total number of votes polled for A and B in 2006 to those polled for C in 2008?
1 : 13 : 6
2 : 2 : 1
3 : 15 : 8
4 : 16 : 9
5 : None of these1 : 13 : 6
AffairsCloud Recommends Oliveboard Mock Test
AffairsCloud Ebook - Support Us to Grow
Govt Jobs by Category
Bank Jobs Notification
