

Hello Aspirants. Welcome to Online Quantitative Aptitude with explanation in AffairsCloud.com. Here we are creating Best question samples from Data Interpretation test with explanation, which is common for all the IBPS,SBI exam,LIC ADO,SSC CGL and other competitive exams. We have included Some questions that are repeatedly asked in bank exams !!!
Directions for questions: Study the following bar graph carefully and answer the questions that follow.
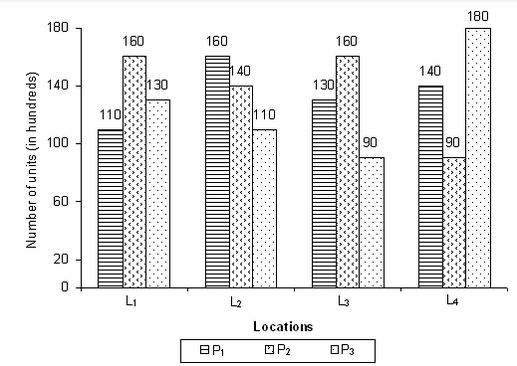
Number of units of three different products P1, P2 and P3, produced (units in hundreds) at four different locations (L1, L=, L3 and L4) of a factory the graph.
- What is the total number of units of P2 produced (in hundreds) in the four locations together?
1 : 540
2 : 550
3 : 510
4 : 530
5 : None of these
[su_accordion]2 : 550
[/su_accordion] - What is the average number of units (in hundreds) of P1 produced per location?
1 : 135
2 : 155
3 : 165
4 : 175
5 : None of these
[su_accordion]1 : 135
[/su_accordion] - In which location is the maximum number of units produced?
1 : L2
2 : L1
3 : L4 and L2
4 : L3 and L1
5 : None of these
[su_accordion]3 : L4 and L2
[/su_accordion] - By what approximate percent is the number of units of P1 produced more than the number of units of P3 produced in the four locations together?
1 : 10.9%
2 : 12.4%
3 : 16.5%
4 : 18.7%
5 : 5.9%
[su_accordion]5 : 5.9%
[/su_accordion] - If the production cost of each of product P2 is Rs.430, then what is the total production cost of P2?
1 : Rs.2,26,200
2 : Rs.2,36,500
3 : Rs.2,46,800
4 : Rs.2,56,400
5 : None of these
[su_accordion]5 :None of these
[/su_accordion]
AffairsCloud Recommends Oliveboard Mock Test
AffairsCloud Ebook - Support Us to Grow
Govt Jobs by Category
Bank Jobs Notification
