

Hello Aspirants. Welcome to Online Quantitative Aptitude section in AffairsCloud.com. Here we are creating question sample From Data Intrepretation that is important for all the competitive exams. We have included Some questions that are repeatedly asked in exams !!
Questions Penned by Yogit
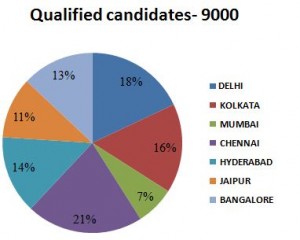
Q(1 –5) study the following pie charts and answer the following questions: 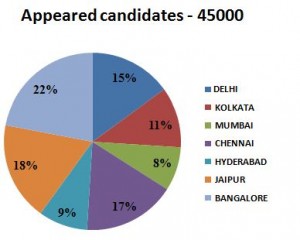
- In which city the percentage qualified candidates with respect to that of appeared candidates is minimum?
a) Delhi
b) Kolkata
c) Mumbai
d) Jaipur
e) none of theseAnswer – e) none of these
Explanation :
Delhi = [(18/100)*9000]/[(15/100)*45000] = 24%
similarly, Kolkata = 29.09% Mumbai = 17.5% Chennai = 24.70% Hyderabad = 31.11% Jaipur = 12.22%
Bangalore = 11.81% - What is the difference between the number of qualified candidates of Chennai and those of Bangalore?
a) 520
b) 676
c) 720
d) 784
e) none of theseAnswer – c) 720
Explanation :
[(21 – 13)/100]*9000 - What is the ratio of appeared candidates from Mumbai and Hyderabad together to that of the appeared candidates from Delhi and Jaipur together?
a) 17:33
b) 11:!3
c) 13:27
d) 17:27
e) none of theseAnswer – a) 17:33
Explanation :
ratio => (17/100)*45000 : (33/100)*45000 = 17:33 - What is the percentage of qualified candidates with respect to appeared candidates from Kolkata and Mumbai taken together?
a) 23.11
b) 23.21
c) 24.21
d) 21.24
e) none of theseAnswer – c) 24.21
Explanation :
23/100*9000 = 2070 (qualified from Kolkata and Mumbai together) 19/100*45000 = 8550 (appeared from Kolkata and Mumbai together)
% = (2070/8550)*100 = 24.21 - What is the ratio between the number of candidates qualified from Kolkata and Chennai together to the number of candidates appeared from Mumbai respectively?
a) 37:41
b) 40:37
c) 37:40
d) 38:41
e) none of theseAnswer – c) 37:40
Explanation :
ratio => (37/100)*9000 : (8/100)*45000 = 37:40
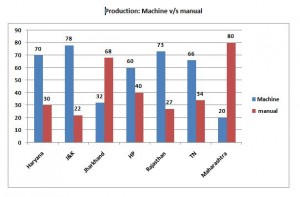
Q(6 –10)study the following pie charts and answer the following questions: –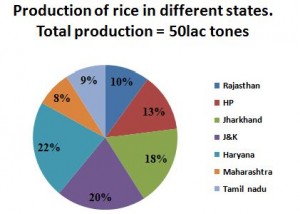
- What is the difference between the production by machine and manual method in Rajasthan?
a) 2.5 lakh
b) 2.3 lakh
c) 2.8 lakh
d) 2.7 lakh
e) none of theseAnswer – b) 2.3 lakh
Explanation :
Rajasthan = (10/100)*50*(73 -27)/100 = 2.3 - What is the ratio of production by manual method in TN to that of machine method in J&K?
a) 9:40
b) 99:260
c) 51:260
d) 33:130
e) none of theseAnswer – c) 51:260
Explanation :
Ratio => (9/100)*50*(34/100) : (20/100)*50*(78/100) = 51/260 - What is the average production of wheat by machine method for all states?
a) 4.24
b) 4.28
c) 4.32
d) 4.46
e) none of theseAnswer – a) 4.24
Explanation :
Rajasthan = (10/100)*50*(73/100) = 3.65 similarly, HP = 3.9 Jharkhand = 2.88 J&K = 7.8 Haryana = 7.7 Maharashtra = 0.8 TN = 2.97
total = 29.7, so average = 29.7/7 = 4.24 - The production by machine method in Haryana is approximately what percent greater than the production by manual method in Maharashtra?
a) 130%
b) 135%
c) 140%
d) 145%
e) none of theseAnswer – c) 140%
Explanation :
Production of Haryana by machine method = 7.7 and production of Maharashtra by manual method = 3.2,
so % greater = [(7.7 – 3.2)/3.2]*100 = 140% - The production of tea in HP by manual method is approximately how many times the production in Jharkhand by machine method?
a) 1.2
b) 1.5
c) 0.9
d) 1
e) 1.3Answer – c) 0.9
Explanation :
Production in HP by manual method = 2.6 and production in Jharkhand by machine method = 2.88
x = 2.6/2.88 = 0.9
Note: Dear Readers if you have any doubt in any chapter in Quants you can ask here. We will clear your doubts
AffairsCloud Recommends Oliveboard Mock Test
AffairsCloud Ebook - Support Us to Grow
Govt Jobs by Category
Bank Jobs Notification
