

Hello Aspirants. Welcome to Online Quantitative Aptitude section in AffairsCloud.com. Here we are creating question sample From Data Intrepretation that is important for all the competitive exams. We have included Some questions that are repeatedly asked in exams !!
Questions Penned by Yogit
Direction: Q(1- 5) Study the following graph and answer the following:–
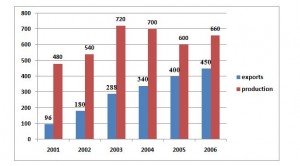
Tea in west Bengal in million kg
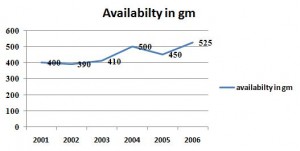
Line graph shows the availability in gram
- The population of west Bengal in 2004 is –
a) 520 million
b) 620 million
c) 720 million
d) 780 million
e) None of theseAnswer – c) 720 million
Explanation :
Production in 2004 = 700 and export = 340, so tea remaining for west Bengal = 700 – 340 = 360 million kg.
So population = (360*1000)/500 = 720 million - What is the first half decade’s average per capita availability of tea?
a) 434
b) 430
c) 456
d) 466
e) None of theseAnswer – b) 430
Explanation :
400 + 390 + 410 + 500 + 450 = 2675, so average = 2150/5 = 430 - Which year shows the maximum percentage of export with respect to production?
a) 2001
b) 2003
c) 2004
d) 2005
e) None of theseAnswer – e) 2006
Explanation :
For 2001 = 96/480 = 0.2
For 2002 = 180/540 = 0.33
For 2003 = 288/720 = 0.4
For 2004 = 340/700 = 0.48
For 2005 = 400/600 = 0.667
For 2006 = 450/660 = 0.681 - What is the average proportion of tea exported to the tea produced over the period?
b) 0.57
c) 0.87
d) 0.93
e) None of theseAnswer – a) 0.47
Explanation :
Average of tea exported = 1754/6
average of tea produced = 3700/6
proportion = 1754/3700 = 0.47 - If the area under tea production was less by 15% in 2005 as compared to 2004, then the approximate rate of increase in productivity of tea in 2005-
a) 25%
b) 30%
c) 40%
d) 10%
e) can’t be determinedAnswer – e) can’t be determined
Explanation :
(6 – 10) Study the following graph carefully and answer the questions accordingly: –
 Ratio of females to males:
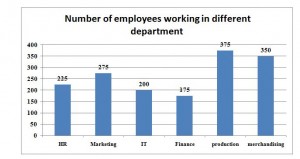
| DEPARTMENT | FEMALES | MALES |
| HR | 9 | 16 |
| MARKETING | 3 | 2 |
| IT | 9 | 31 |
| FINANCE | 2 | 3 |
| PRODUCTION | 11 | 4 |
| MERCHANDISING | 4 | 3 |
- What is the total number of males working in all the department together?
a) 463
b) 654
c) 764
d) 906
e) None of theseAnswer – c) 764
Explanation :
225*16/25 + 275*2/5 + 200*31/40 + 175*3/5 + 375*4/15 + 350*3/7 = 764 - What is the number of females working in HR department?
a) 71
b) 64
c) 81
d) 90
e) None of theseAnswer – c) 81
Explanation :
225*9/25 = 81 - What is the ratio of total number of employees working in production department to those working in merchandising department
a) 14:15
b) 12:17
c) 15:16
d) 15:14
e) None of theseAnswer – d) 15:14
Explanation :
375:350 = 15:14 - What is the ratio of the number of females working in HR department to that of males working in production department?
a) 81:99
b) 81:100
c) 100:81
d) 121:100
e) None of theseAnswer – b) 81:100
Explanation :
[225*9/25]/[375*4/15] = 81 : 100 - In which department are the lowest number of females is working?
a) Marketing
b) Finance
c) Production
d) HR
e) ITAnswer – e) IT
Explanation :
IT = 200*9/40 = 45
AffairsCloud Recommends Oliveboard Mock Test
AffairsCloud Ebook - Support Us to Grow
Govt Jobs by Category
Bank Jobs Notification
