

Hello Aspirants. Welcome to Online Quantitative Aptitude section in AffairsCloud.com. Here we are creating question sample From Data Intrepretation that is important for all the competitive exams. We have included Some questions that are repeatedly asked in exams !!
Study the following graph to answer the following questions
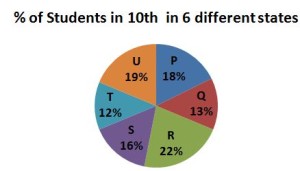
Total number of students = 90,000
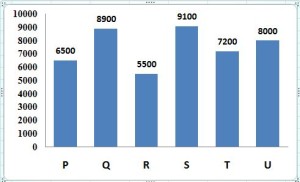
Number of Boys student in each district out of 90,000
- The no of girls students in District T is what % of the total no students in District Q ?
A)47%
B)31%
C)37%
D)40%B)31%
Explanation :
No of girls in T = (12*90000/100)-7200 = 10800 – 7200 = 3600
Total no of students in Q = 13*90000/100 = 11700
% = 3600*100/11700 = 30.77% = 31% - What is the average number of boys students in all the districts together ?
A)7533
B)7355
C)7550
D)7300A)7533
Explanation :
6500+8900+5500+9100+7200+8000/6 = 45200/6 = 7533 - What is the difference between the number of girls students in District P and the total number of students in district R ?
A)11000
B)9700
C)10000
D)10100D)10100
Explanation :
Total no of students in R = 22*90000/100 = 19800
No of girls in P = (18*90000/100)-6500 = 16200 -6500 = 9700
Difference = 19800 – 9700 = 10100 - What is the ratio of the no of boys in District U to the total no of girls in District S ?
A)43:76
B)50:75
C)53:80
D)80:53D)80:53
Explanation :
Boys in U = 8000
Girls in S = (16*90000/100)-9100 = 5300
80:53 - What is the total no of students in District P,R and T ?
A)46000
B)46800
C)48600
D)45000B)46800
Explanation :
P = 18*90000/100 = 16200
R = 22*90000/100 = 19800
T = 12*90000/100 = 10800
Total = 46,800
II. Study the following graph to answer the following questions
Note : all the data in percentage
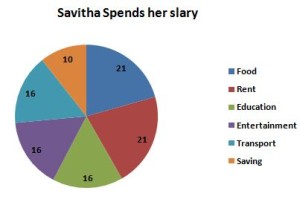
- If saving amount is 12,000 ,then find her salary ?
A)Rs.1,15,000
B) Rs.1,20,000
C) Rs.1,10,000
D) Rs.1,00,000B) Rs.1,20,000
Explanation :
10 %= 12000
100% = 100*12000/10 = 1,20,000 - Amount spent on Transport is what % of the amount spent on food ?
A)65%
B)80%
C)76%
D)71%C)76%
Explanation :
T = 16*1,20,000/100 = 19,200
F = 21*1,20,000/100 =25,200
% = 19200*100/25200 = 76.19 = 76% - How much money spent for entertainment and rent together ?
A) Rs.44,400
B) Rs.40,000
C) Rs.44,000
D) Rs.39,500A) Rs.44,400
Explanation :
E = 16*1,20,000/100 = 19,200
R = 21*1,20,000/100 =25,200
Total = 19200+25200 = 44400 - Ratio between the amount spent on Education and Saving ?
A)2:5
B)1:3
C)8:5
D)2:5C)8:5
Explanation :
E = 16% = 16*1,20,000/100 = 19,200
S = 10% = 12,000
E : S = 192 :120 = 8:5 - If her salary is increased by 20% and decreased by 5% then what will be her salary now ?
A)Rs.1,36,800
B)Rs.1,44,000
C)Rs.1,36,000
D)Rs.1,32,000A)Rs.1,36,800
Explanation :1,20,000*(120/100)*(95/100) = 1,36,800
AffairsCloud Recommends Oliveboard Mock Test
AffairsCloud Ebook - Support Us to Grow
Govt Jobs by Category
Bank Jobs Notification
