

Hello Aspirants. Welcome to Online Quantitative Aptitude section in AffairsCloud.com. Here we are creating question sample From Data Intrepretation that is important for all the competitive exams. We have included Some questions that are repeatedly asked in exams !!
Questions Penned by Yogit
Direction: Q(1 –5) Study the following charts and answer the following questions:

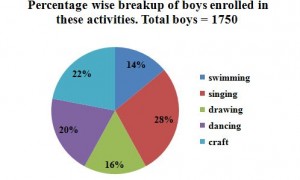
- What is the % of number of girls in the school(approx)?
a) 28
b) 32
c) 38
d) 42
e) None of theseAnswer – d) 42
Explanation :
girls = 3000 – 1750 = 1250, so (1250/3000)*100 = 41.67% - How many girls are enrolled in singing and craft together?
a) 505
b) 610
c) 705
d) 810
e) None of theseAnswer – a) 505
Explanation :
total students in singing and craft = (46/100)*3000 = 1380
number of boys in singing and craft = (50/100)*1750 = 875
so number of girls = 1380 – 875 = 505 - The number of boys enrolled in dancing form what percent of the total number of students in the school?
a) 12.66
b) 11.67
c) 13.67
d) 14.77
e) None of theseAnswer – b) 11.67
Explanation :
(350/3000)*100 = 11.67% - What is the ratio of the number of boys enrolled in swimming to the number of girls enrolled in swimming?
a) 43:47
b) 47: 43
c) 49:47
d) 47:49
e) None of theseAnswer – c) 49:47
Explanation :
boys = 245 and girls = 480 – 245 = 235 - What is the total number of boys enrolled in swimming and drawing together?
a) 505
b) 515
c) 525
d) 535
e) None of theseAnswer – c) 525
Explanation :
(30/100)*1750 = 525
Direction: Q(6 –10) Study the following graphs and answer the following questions:
Number of students in different branches in 5 colleges
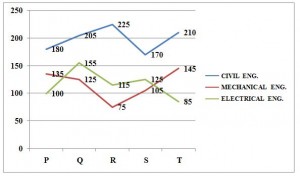
- What is the difference between the average number of civil engineers and electrical engineers?
a) 65
b) 70
c) 75
d) 82
e) None of theseAnswer – d) 82
Explanation :
Total civil engineers = 990 and total electrical engineers = 580
Now (990 – 580)/5 = 82 (difference between the average number of civil engineers and electrical engineers) - In college R, number of mechanical engineers is what percent of civil engineers?
a) 33.33%
b) 37.37%
c) 43.33%
d) 16.67%
e) None of theseAnswer – a) 33.33%
Explanation :
(75/225)*100 = 33.33% - The number of civil engineers is what percent of the total number of mechanical engineers from all college together?
a) 149%
b) 139%
c) 159%
d) 169%
e) None of theseAnswer – d) 169%
Explanation :
total civil engineers = 990 and total mechanical engineers = 585
so percent = (585/990)*100 = 169.23% - Find the ratio of the number of colleges in which number of electrical engineers is above average and those in which the number is below average?
a) 2:3
b) 3:2
c) 1:4
d) 4:1
e) None of theseAnswer – a) 2:3
Explanation :
average electrical engineers = 580/5 = 116
Number of colleges in which electrical engineers are above average = 2 and below average = 3 - The number of civil engineers in college S is what percent more than the number of mechanical engineers in the same college?
a) 60%
b) 62%
c) 64%
d) 65%
e) None of theseAnswer – b) 62%
Explanation :
civil engineers = 170. Mechanical engineers = 105
[(170-105)/105]*100 = 62% (approx)
Note: Dear Readers if you have any doubt in any chapter in Quants you can ask here. We will clear your doubts
AffairsCloud Recommends Oliveboard Mock Test
AffairsCloud Ebook - Support Us to Grow
Govt Jobs by Category
Bank Jobs Notification
