

Hello Aspirants.
Welcome to Online Quantitative Aptitude section in AffairsCloud.com. Here we are creating question sample From Data Interpretation that is important for all the competitive exams. We have included Some questions that are repeatedly asked in exams.
I. (Q.no: 1-5). Refer to the following Line Graph and answer the given questions.
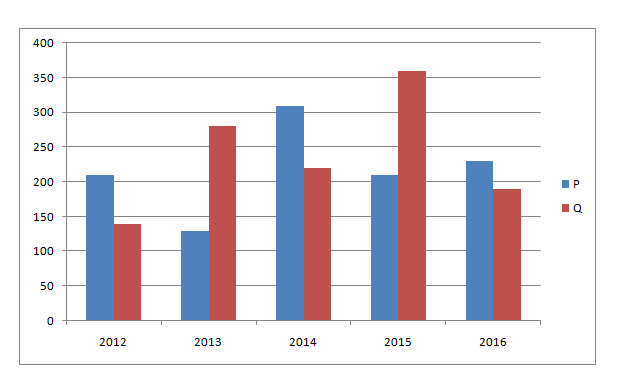
| University | 2012 | 2013 | 2014 | 2015 | 2016 |
|---|---|---|---|---|---|
| P | 210 | 130 | 310 | 210 | 230 |
| Q | 140 | 280 | 220 | 360 | 190 |
- In 2013, out of the total number of applications received for Universities P and Q together, only 30% were accepted. What was the total number of applications accepted for Universities P and Q together in 2013?
A. 132
B. 135
C. 141
D. 123
E. None of the AboveAnswer – D. 123
Explanation :
Total number of applications accepted by P and Q together in 2013 = (130 + 280)*30/100
=123 - In 2012, 30% of applications received for University P and 20% of applications received for University Q were from international students. What was the total number of International applicants for University P and Q together in 2012?
A. 91
B. 97
C. 89
D. 93
E. 87Answer – A. 91
Explanation :
Total Number of International applicants for University P and Q together = 210*30/100 + 140 * 20/100
= 63 + 28 = 91 - If the respective ratio of total number of applications received for University P and Q together in 2016 and 2017 is 3:4. What was the total number of applications received for University P and Q together in 2017?
A. 456
B. 560
C. 540
D. 530
E. None of the AboveAnswer – B. 560
Explanation :
Total number of applications received for Universities P and Q together in 2016 = 230 + 190 = 420
Total number of applications received for Universities P and Q together in 2017 = 420 * 4/3 = 560 - What is the average number of applications received for University P in 2013, 2015 and 2016?
A. 190
B. 180
C. 170
D. 200
E. 160Answer – A. 190
Explanation :
Average number of applications received for University A in 2013, 2015 and 2016 = (130 + 210 + 230)/3 = 190 - Number of applications received for University Q increased by what percent from 2012 to 2014?
A. 100/7%
B. 200/7%
C. 300/7%
D. 400/7%
E. None of theseAnswer – D. 400/7%
Explanation :
% = (220-140)/140 * 100 = 400/7 %
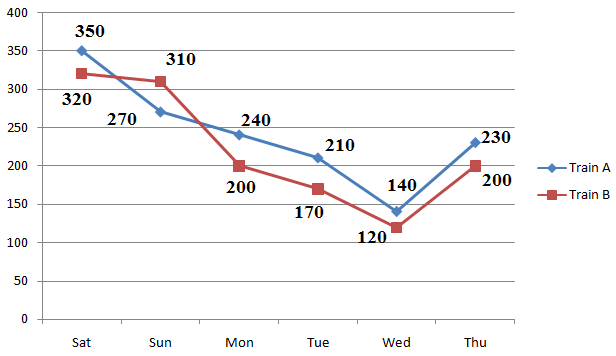
II. (Q.no: 6-10). Refer to the following Line Graph and answer the given questions.
- The number of people who traveled by Train B on Friday is 30% more than the people who traveled by the same train on Thursday. What is the respective ratio between the number of people who traveled on Friday and those who traveled on Saturday by the same train?
A. 14:15
B. 13:14
C. 15:16
D. 13:14
E. 13:16Answer – E. 13:16
Explanation :
30% of 200 = 60
People traveled by Train B on Friday = 260
260 : 320 = 13 : 16 - What is the difference between the total number of people who traveled by Train B on Saturday and Sunday together and the total number of people who traveled by Train A on Saturday and Sunday together?
A. 20
B. 30
C. 10
D. 50
E. 40Answer – C. 10
Explanation :
Train B on Saturday and Sunday together = 320 + 310 = 630
Train A on Saturday and Sunday together = 350 + 270 = 620
Difference = 630 – 620 = 10 - What is the average number of people traveling by Train B on Monday, Tuesday, Wednesday and Thursday?
A. 160.5
B. 130.5
C. 172.5
D. 165.5
E. 164.5Answer – C. 172.5
Explanation :
200 + 170 + 120 + 200
= 172.5 - The number of people who traveled by Train A decreased by what percent from Saturday to Wednesday?
A. 30%
B. 60%
C. 30%
D. 42%
E. 33%Answer – B. 60%
Explanation :
[(350 – 140)/350]*100
= [210/350]*100 = 60% - The total number of people who traveled by both the given trains together on Monday is approximately what percent more than the total number of people who traveled by both the given trains together on Wednesday?
A. 68%
B. 63%
C. 62%
D. 69%
E. 65%Answer – D. 69%
Explanation :
(440 – 260)/260*100
= 180/260 * 100
= 69%
AffairsCloud Recommends Oliveboard Mock Test
AffairsCloud Ebook - Support Us to Grow
Govt Jobs by Category
Bank Jobs Notification
