

Hello Aspirants.
Welcome to Online Quantitative Aptitude section in AffairsCloud.com. Here we are creating question sample From Data Interpretation that is important for all the competitive exams. We have included Some questions that are repeatedly asked in exams.
Bank PO Level Questions :-
I. Study the following table and Pie-Chart carefully and answer the following questions given below.
Number of students studying in different streams in six engineering colleges
| Colleges | Computer Science | Electrical Engineering | Electronics | Civil | Mechanical | Others |
|---|---|---|---|---|---|---|
| M | 250 | 320 | 160 | 272 | 128 | 150 |
| N | 120 | 210 | 200 | 150 | 180 | 220 |
| O | 220 | 150 | 220 | 160 | 200 | 120 |
| P | 180 | 170 | 140 | 128 | 100 | 172 |
| Q | 240 | 220 | 180 | 170 | 190 | 200 |
| R | 160 | 200 | 150 | 190 | 150 | 160 |
Pie-charts show the distribution of students in different states in colleges N and Q.
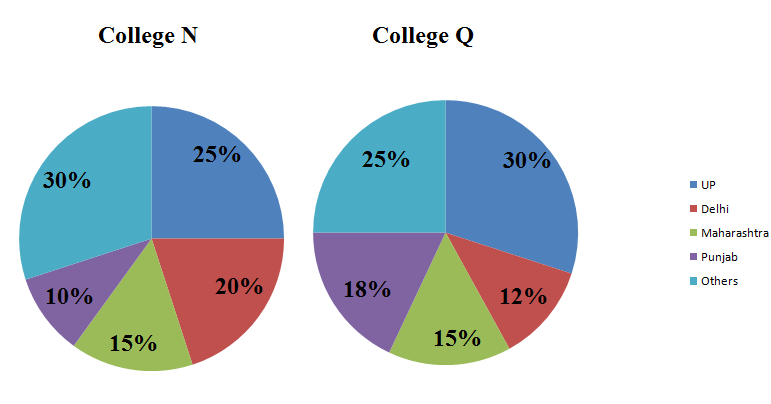
- How many students doing in civil engineering in College N, were from UP?
A. 35
B. 60
C. 55
D. Can not be determinedAnswer – D. Can not be determined
Explanation :
Given data is not sufficient to calculate the answer. - What is the difference between the number of students from Delhi in colleges N and Q?
A. 34
B. 50
C. 60
D. 72Answer – D. 72
Explanation :
Total number of students in college N = 1080
Number of students from Delhi in college N = 1080 * (20/100) = 216
Total number of students in college Q = 1200
Number of students from Delhi in college N = 1200 * (12/100) = 144
Difference = 216 – 144 = 72 - What is the difference between the number of students pursuing computer science and those pursuing mechanical engineering in the given six colleges?
A. 205
B. 224
C. 222
D. 220Answer – C. 222
Explanation :
Number of students pursuing computer science = 250 + 120 + 220 + 180 + 240 + 160 = 1170
Number of students pursuing mechanical engineering = 948
Difference = 1170 – 948 = 222 - By what percentage is the number of students from Punjab in college N more/less than those from Maharashtra in college Q?
A. 50%
B. 40%
C. 20%
D. 30%Answer – B. 40%
Explanation :
Number of students from Punjab in college N = 1080 * (10/100) = 108
Number of students from Maharashtra in college Q = 1200 * (15/100) = 180
Percentage = [(180 – 108)*100] = 40% - The total number of students in college R forms approximately what percentage of the total number of students in colleges M, N and P together?
A. 25%
B. 33%
C. 31%
D. 35%Answer – C. 31%
Explanation :
Total number of students in colleges M, N and P = 1280 + 1080 + 890 = 3250
Total number of students in college R = 1010
Percentage = [(1010/3250)*100] = 31%(approximately)
II. Study the following bar graph and table carefully and answer the following questions given below.
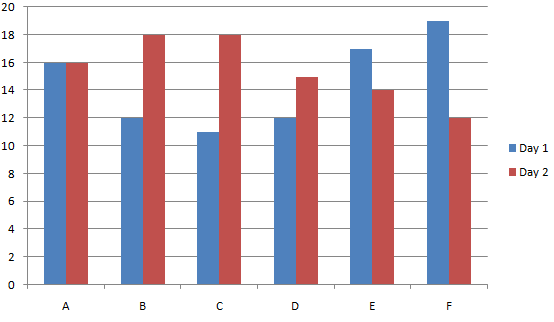
Time taken to travel (in hours) by six vehicles on two different days.
Distance covered by six vehicles on each day
| Vehicle | Day 1 | Day 2 |
|---|---|---|
| A | 832 | 864 |
| B | 516 | 774 |
| C | 693 | 810 |
| D | 552 | 765 |
| E | 935 | 546 |
| F | 703 | 636 |
- Which of the following vehicles travelled at the same speed on both the days?
A. Vehicle A
B. Vehicle B
C. Vehicle C
D. Vehicle DAnswer – B. Vehicle B
Explanation :
Speed of vehicle A on day 1 = 832/16 = 52kmph
Speed of vehicle A on day 2 = 864/16 = 54kmph
Speed of vehicle B on day 1 = 516/12 = 43kmph
Speed of vehicle B on day 2 = 774/18 = 43kmph
Speed of vehicle C on day 1 = 693/11 = 63kmph
Speed of vehicle C on day 2 = 810/18 = 45kmph
Speed of vehicle D on day 1 = 552/12 = 46kmph
Speed of vehicle D on day 2 = 765/15 = 51kmph
Vehicle B travelled at the same speed on both the days - What was the difference between the speed of vehicle A on day 1 and the speed of the vehicle on the same day?
A. 22 kmph
B. 11 kmph
C. 10 kmph
D. 13 kmphAnswer – B. 11 kmph
Explanation :
Speed of vehicle A on day 1 = 832/16 = 52kmph
Speed of vehicle C on day 1 = 693/11 = 63kmph
Difference = 63-52 = 11kmph - What was the speed (in m/s) of vehicle C on day 2?
A. 12.5 m/s
B. 11.5 m/s
C. 10.5 m/s
D. 9.5 m/sAnswer – A. 12.5 m/s
Explanation :
Speed of vehicle C on day 2 = 810/18 = 45kmph
Speed of vehicle C on day 2 = 45 * (5/18) = 12.5 m/s - The distance travelled by vehicle F on day 2 was approximately what % of the distance travelled by it on day 1?
A. 90%
B. 95%
C. 94%
D. 98%Answer – A. 90%
Explanation :
Percentage = (636/703)*100 = 90% - What is the ratio of speeds of vehicle D and Vehicle E on day 2?
A. 14:15
B. 17:13
C. 15:16
D. 13:17Answer – B. 17:13
Explanation :
Speed of vehicle D on day 2 = 51kmph
Speed of vehicle E on day 2 = 39kmph
Ratio = [Speed of vehicle D on day 2/Speed of vehicle E on day 2] = 51/39 = 17:13
AffairsCloud Recommends Oliveboard Mock Test
AffairsCloud Ebook - Support Us to Grow
Govt Jobs by Category
Bank Jobs Notification
