

Hello Aspirants.
Welcome to Online Quantitative Aptitude section in AffairsCloud.com. Here we are creating question sample From Data Intrepretation that is important for all the competitive exams. We have included Some questions that are repeatedly asked in exams.
Bank PO Level Questions :-
I. Study the following Radar Graph and answer the given questions
Number of new countries registered (in thousand) in four countries in various years.
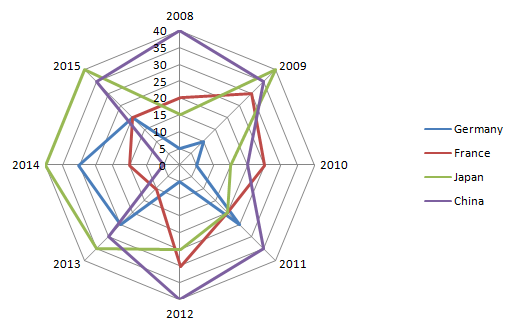
- In which year is the average of the number of companies registered the maximum?
A. 2008
B. 2010
C. 2009
D. 2011Answer – C. 2009
Explanation :
Average of the number of companies registered in 2008 = [5 + 20 + 15 + 40]*1000/4 = 20000
Average of the number of companies registered in 2009 = [10 + 30 + 40 + 35]*1000/4 = 28750
Average of the number of companies registered in 2010 = [5 + 25 + 15 + 20]*1000/4 = 16250
Average of the number of companies registered in 2011 = [25 + 20 + 20 + 35]*1000/4 = 25000 - The number of companies registered in 2015 is what percentage more or less than the number of companies registered in the year 2008?
A. 44.44%
B. 43.75%
C. 22.22%
D. 11.11%Answer – B. 43.75%
Explanation :
Number of companies registered in 2015 = [20 + 20 + 40 + 35]*1000 = 115000
Number of companies registered in 2008 = [5 + 20 + 15 + 40]*1000 = 80000
% = [(115000 – 80000)/ 80000]*100 = 43.75% more - What is the ratio of the number of companies registered in Japan to that in China during 2008 to 2015?
A. 39:40
B. 23:24
C. 40:41
D. 24:23Answer – B. 23:24
Explanation :
Number of companies registered in Japan during 2008 to 2015 = 230*1000 = 230000
Number of companies registered in China during 2008 to 2015 = 240*1000 = 240000
Ratio = 23:24 - The total number of companies registered in France is how much more or less than the total number of companies registered in China?
A. 34.14%
B. 33.13%
C. 29.16%
D. 11.11%Answer – C. 29.16%
Explanation :
Total number of companies registered in France = 170*1000 = 170000
Total number of companies registered in china = 240*1000 = 240000
% = [(240000 – 170000)/ 240000]*100 = 29.16% less - In which country is the average number of companies registered the maximum?
A. Germany
B. Japan
C. China
D. FranceAnswer – C. China
Explanation :
Average number of companies registered in France = 170000/4 = 42500
Average number of companies registered in Germany = 125000/4 = 31250
Average number of companies registered in Japan = 230000/4 = 57500
Average number of companies registered in China = 240000/4 = 60000
Average number of companies registered in China is the maximum
Study Pie-Chart and table carefully to answer the following questions.
Pie-Chart showing percentage distribution-wise of cars in four different states
Total Cars = 700
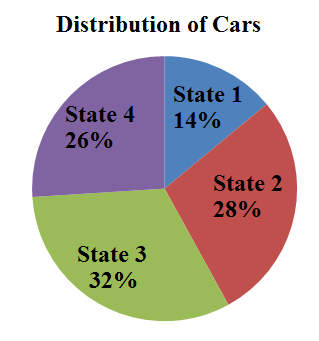
| States | Diesel engine cars | Petrol engine cars |
|---|---|---|
| State 1 | 3 | 4 |
| State 2 | 5 | 9 |
| State 3 | 5 | 3 |
| State 4 | 1 | 1 |
- What is the difference between the number of diesel engine cars in state 2 and the number of petrol engine cars in state 4?
A. 21
B. 23
C. 25
D. 24Answer – A. 21
Explanation :
Total no of cars in state 2 = 28% of 700 = 196
Number of diesel engine cars in state 2 = 196 * 5/14 = 70
Total no of cars in state 4 = 26% of 700 = 182
Number of petrol engine cars in state 4 = 182 * 1/2 = 91
Required difference = 91 – 70 = 21 - Number of petrol engine cars in state 3 is what percent more than the number of diesel engine cars in state 1?
A. 200%
B. 300%
C. 400%
D. 100%Answer – D. 100%
Explanation :
Total no of cars in state 3 = 32% of 700 = 224
Number of petrol engine cars in state 3 = 224 * 3/8 = 84
Total no of cars in state 1 = 14% of 700 = 98
Number of diesel engine cars in state 1 = 98* 3/7 = 42
% = [(84-42)/42]*100 = 100% - If 25% of diesel engine cars in state 3 are AC and remaining cars are non-AC, what is the number of diesel engine cars in state 3 which are non AC?
A. 75
B. 95
C. 105
D. 100Answer – C. 105
Explanation :
Total no of cars in state 3 = 32% of 700 = 224
Number of diesel engine cars in state 3 = 224* 5/8 = 140
Number of diesel engine AC cars in state 3 = 25% of 140 = 35
Number of diesel engine non-AC cars = 140-35 = 105 - What is the difference between the total number of cars in state 3 and the number of petrol engine cars in state 2?
A. 75
B. 95
C. 85
D. 98Answer – D. 98
Explanation :
Total no of cars in state 3 = 32% of 700 = 224
Total no of cars in state 2 = 28% of 700 = 196
Number of petrol engine cars in state 2 = 196*(9/14) = 126
Required difference = 224 – 126 = 98 - What is the average number of petrol engine cars in states together?
A. 75.25
B. 95.25
C. 85.25
D. 89.25Answer – D. 89.25
Explanation :
Total no of cars in state 1 = 14% of 700 = 98
Total no of cars in state 2 = 28% of 700 = 196
Total no of cars in state 3 = 32% of 700 = 224
Total no of cars in state 4 = 26% of 700 = 182
Number of petrol engine cars in state 1 = 98 * 4/7 = 56
Number of petrol engine cars in state 2 = 196 * 9/14 = 126
Number of petrol engine cars in state 3 = 224 * 3/8 = 84
Number of petrol engine cars in state 4 = 182 * 1/2 = 91
Average total number of petrol engine cars in all states = (56 + 126 + 84 + 91)/4 = 89.25
AffairsCloud Recommends Oliveboard Mock Test
AffairsCloud Ebook - Support Us to Grow
Govt Jobs by Category
Bank Jobs Notification
