

Hello Aspirants. Welcome to Online Quantitative Aptitude section in AffairsCloud.com. Here we are creating question sample From Data Intrepretation that is important for all the competitive exams. We have included Some questions that are repeatedly asked in exams !!
I.Study the following table carefully to answer the given questions
| Year | UP | MP | Assam | |||
| Appeared | Qualified | Appeared | Qualified | Appeared | Qualified | |
| 2005 | 400 | 68% | 430 | 45% | 520 | – |
| 2006 | 670 | 62% | – | 50% | 540 | 70% |
| 2007 | 520 | 76% | 680 | 43% | – | 41% |
| 2008 | 560 | – | 530 | 48% | 564 | 34% |
| 2009 | 630 | 56% | 500 | 50% | 490 | 78% |
- The no of appeared candidates from state MP increased by 70% from 2005 to 2006 then what is the number of Qualified students in 2006 in the same state ?
A.380
B.460
C.366
D.420
E.None of theseAnswer – C.366
Explanation :
430*170/100 = 430+301 = 731
Qualified = 731*50/100 = 365.5 = 366 - The no of students qualified from Assam in 2007 is 246, then what is the ratio of Qualified students and not Qualified students in the same year in Assam ?
A.59:41
B.41:59
C.59:46
D.42:55
E.None of theseAnswer – B.41:59
Explanation :
41% = 246
100% = 600
246:354 = 41 : 59 - If the total number of students Qualified in 2008 in all the states together is 712, then the no of students Qualified in state UPis what % of the total no of students appeared in the State UP(round off to the whole number) ?
A.64%
B.56%
C.50%
D.48%
E.None of theseAnswer – D.48%
Explanation :
560*x% + 530*48% + 564*34% = 712
560*x/100 + 254+192 = 712
560*x/100 = 266
X = 266*100/560 = 47.5% - Find the average number of students qualified from the sate UP in all the years together ?
A.410
B.278
C.340
D.360
E.None of theseAnswer – C.340
Explanation :
Avg =[400*68% + 670*62% + 520*76% + 266 + 630*56%]/5
= 272+415+395+266+353/5
= 1701/5 = 340.2 = 340 - What is the difference between the no of students Qualified in 2009 and 2007 in all the states together ?
A.52
B.69
C.43
D.37
E.None of theseAnswer – A.52
Explanation :
2007 : 395+292+246 = 933
2009 : 353 + 250 + 382 = 985
Diff = 985 – 933 =52
II.Study the following graph carefully to answer the given questions
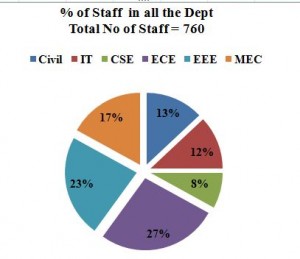
- What is the total no of staff in IT, ECE and MEC ?
A.390
B.425
C.345
D.478
E.None of theseAnswer – B.425
Explanation :
Total = 760*12/100 + 760*27/100 + 760*17/100
= 91+205+129 = 425 - If three-seventh of the staff whose in CSE are female, then the no of female staff is what % of the total no of staff whose in EEE ?
A.15%
B.13%
C.17%
D.21%
E.None of theseAnswer – A.15%
Explanation :
EEE = 760*23/100 = 175
CSE = 760*8/100 = 61
61*3/7 = 26
% = 26*100/175 = 14.8 = 15% - What is the difference between the total no of staff whose in CSE and IT together to the total no of staff whose in Civil and EEE together ?
A.140
B.210
C.167
D.122
E.None of theseAnswer – D.122
Explanation :
CSE+IT = 61+ 91 = 152
Civil + EEE = 99+175 = 274
Diff = 274 – 152 = 122 - What is the ratio of number of Staff in Civil to the total no of staff in IT and MEC ?
A.13:17
B.9:20
C.20:11
D.11:18
E.None of theseAnswer – B.9:20
Explanation :
C : IT+Mec = 99 : 91+129 = 99: 220 = 9:20 - If the number of female students in ECE is 40% of the total no of staff in ECE, then find the total no of male staff ?
A.82
B.97
C.104
D.123
E.None of theseAnswer – D.123
Explanation :
ECE = 205
F = 205*40/100 = 82
M = 205-82 = 123
Note : Dear Friends if u know an alternate methods or shortcuts related to any chapter, you can share here.
AffairsCloud Recommends Oliveboard Mock Test
AffairsCloud Ebook - Support Us to Grow
Govt Jobs by Category
Bank Jobs Notification
