

Hello Aspirants. Welcome to Online Quantitative Aptitude section in AffairsCloud.com. Here we are creating question sample From Data Intrepretation that is important for all the competitive exams. We have included Some questions that are repeatedly asked in exams !!
I. Study the following graph carefully to answer the given Questions
No of students(in hundred) who participated in three different sports in six different years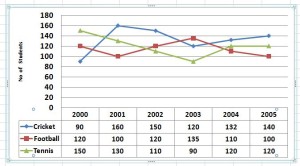
- What is the difference between the no of players participating in Football in the year 2002 and the no of players participating in Cricket in the year 2005 ?
A)1000
B)2000
C)2200
D)1700B)2000
Explanation :
2002 F = 12000
2005 C = 14000
D = 14000 – 12000 = 2000 - The total no of players who participated in all the 3 sports together in the year 2004 was What % of the total no of players who participated in Tennis over all the years together(approx) ?
A)50%
B)45%
C)47%
D)53%A)50%
Explanation :
2004 total = 132+110+120 = 36200
Tennis total = 72000
% = 36200*100/72000 = 50.28% - What was the average no of players who participated in Football over all the years together ?
A)11417
B)11490
C)12476
D)10976A)11417
Explanation :
120+100+120+135+110+100/6 = 685/6 = 114.17
114.17*100 = 11417 - What was the % decrease in the no of players participating in Cricket in the year 2003 as compared to that in the year 2001 ?
A)45%
B)35%
C)25%
D)None of theseC)25%
Explanation :
2003 = 12000
2001 = 16000
% = (16000-12000/16000)*100 = 25% - Find the ratio between the no of students participated in Cricket & Football in 2001 to the total no of students participated in Cricket and Tennis in 2004 ?
A)20:17
B)65:63
C)60:43
D)55:52B)65:63
Explanation :
2001 = 260
2004 = 252
R = 260:252 = 65:63
II. Study the following graph carefully to answer the given Questions
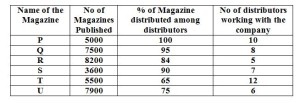
- The no of magazines distributed by company R is what % of the no of Magazine distributed by Company U ?
A)124%
B)116%
C)120%
D)104%B)116%
Explanation :
R = (8200*84)/100 =6888
U = (7900*75)/100 = 5925
% = (6888/5925)*100 = 116.25% = 116% - What was the average no of Magazine published by Company Q,S and T together ?
A)5231
B)5545
C)5533
D)6543C)5533
Explanation :Q+S+T/3 = 7500+3600+5500/3 = 5533.3 = 5533 - What was the difference between the no of magazine received by each distributor working with the Company Q and the no of magazine received by each distributor working with the company S ?
A)428
B)432
C)564
D)389A)428
Explanation :
Q = 7500*95/100 =7125 = 8 distributor
1 distributor = 7125/8 = 890.6 = 891
S = 3600*90/100 = 3240 = 7 distributor
1 distributor = 3240/7 = 462.8 = 463
Diff = 891-463 = 428 - Among the total no of magazine published by Company R, the ratio of banking and non banking magazine is 7:5. Find the no of banking Magazine distributed by Company R?
A)5430
B)4390
C)3416
D)4783D)4783
Explanation :Banking = 8200*7/12 = 4783 - The number of magazine distributed by Company U is what % more than the no of magazine distributed by Company P ?
A)15.5%
B)20.7%
C)18.5%
D)25%C)18.5%
Explanation :
P = 5000*100/100 = 5000
U = 7900*75/100 = 5925
% = (5925-5000/5000)*100 = 18.5%
AffairsCloud Recommends Oliveboard Mock Test
AffairsCloud Ebook - Support Us to Grow
Govt Jobs by Category
Bank Jobs Notification
