

Hello Aspirants. Welcome to Online Quantitative Aptitude section in AffairsCloud.com. Here we are creating question sample From Data Intrepretation that is important for all the competitive exams. We have included Some questions that are repeatedly asked in exams !!
I.Study the following information carefully to answer the given questions
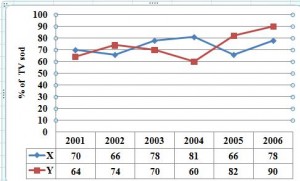
Following bar graph shows the number of TV produced by two Companies X and Y during 2001 to 2006, and the line graph shows the percentage of TV sold by these companies.
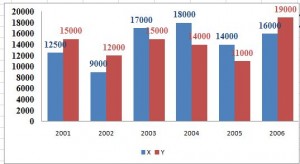
- What is the percentage rise in production of Company x from year 2002 to year 2003?
A.80%
B.90%
C.92%
D.76%
E.None of theseAnswer – B.90%
Explanation :
% = [17000-9000/9000]*100 = 88.89 = 90% - The number of TV sold in year 2004 by Company x is what percentage of the total number of TV sold by Company y in year 2002?
A.182%
B.156%
C.167%
D.170%
E.None of theseAnswer – C.167%
Explanation :
2004 X = 81*18000/100 =14580
2002 Y = 74*12000/100 = 8880
% = [14580/8880]*100 = 167.23 = 167% - What is the total number of unsold TV of Company Y in all six years together?
A.22500
B.20000
C.18000
D.12000
E.None of theseAnswer – A.22500
Explanation :
2001 = 15000*64/100 = 9600
2002 = 12000*74/100 = 8880
2003 = 15000*70/100 = 10500
2004 = 14000*60/100 = 8400
2005 = 11000*82/100 = 9020
2006 = 19000*90/100 = 17100
Unsold TV = 5400+3120+4500+5600+1980+1900 = 22500 - In which of the following years is the percentage rise in production compared to its previous year the highest for Company B?
A.2006
B.2004
C.2002
D.2003
E.None of theseAnswer – A.2006 - In which of the following years is the difference between the number of TV sold by Company X and that by Company Y the maximum?
A.2001
B.2003
C.2004
D.2006
E.None of theseAnswer – C.2004
Explanation :
2001 = 9600 – 8750 = 850
2002 = 8880 – 5940 = 2940
2003 = 13260 – 10500 = 2760
2004 = 14580 – 8400 = 6180
2005 = 9240 – 9020 = 220
2006 = 17100 – 12480 = 4620
II.Study the following information carefully to answer the given questions
Profit made by three companies over 3 years
Profit = Income – Expenditure
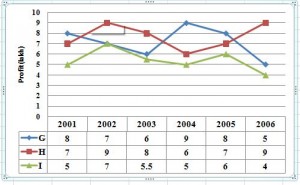
- Profit made by Company H in the year 2003 was what % of the total profit made by all the three companies in the same year ?
A.51%
B.32%
C.41%
D.27%
E.None of theseAnswer – C.41%
Explanation :
H = 8
G+H+I = 6+8+5.5
% = 8*100/19.5 = 41.02% = 41% - If the income of the company G in the year 2005 was Rs.15,60,000, What was its expenditure in that year ?
A.8.5lakh
B.5.2lakh
C.6.8lakh
D.7.6lakh
E.None of theseAnswer – D.7.6lakh
Explanation:
E = I – P
E = 15,60,000 – 8,00,000 = 7,60,000 - If the expenditure of Company I in the year 2006 was Rs.7,89,500. What was its income in that year ?
A.Rs.10,89,000
B.Rs.12,89,000
C.Rs.11,89,500
D.Rs.13,00,500
E.None of theseAnswer – C.Rs.11,89,500
Explanation:
I = P + E
I = 7,89,500+4,00,000 = 11,89,500 - What is the % increase in profit of company G in 2004 from the previous year ?
A.20%
B.50%
C.25%
D.40%
E.None of theseAnswer – B.50%
Explanation:
2003 = 6, 2009 = 9
% = [9-6/6]*100 = 50% - What is the % decrease in profit made by state H from 2002 to 2005 ?
A.22%
B.30%
C.16%
D.37%
E.None of theseAnswer – A.22%
Explanation :
2002 = 9
2005 = 7
% = [9-7/9]*100 = 22%
Note : Dear Friends if u know an alternate methods or shortcuts related to any chapter, you can share here.
