

Hello Aspirants.
Welcome to Online Reasoning Section with the explanation in AffairsCloud.com. Here we are creating Best question samples for IBPS PO 2017. We have included Some questions that are repeatedly asked in bank exams !!!
Click Here to View Cumulus Course: IBPS PO 2017
IBPS PO 2017: Reasoning Test– 6 PM Every Day
IBPS PO 2017: Quants Test– 7 PM Every Day
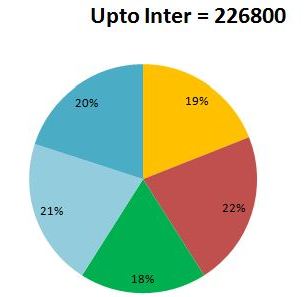
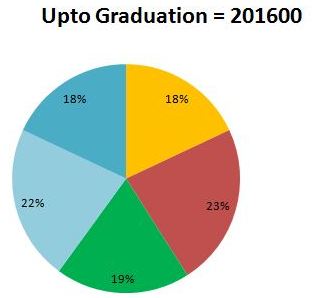
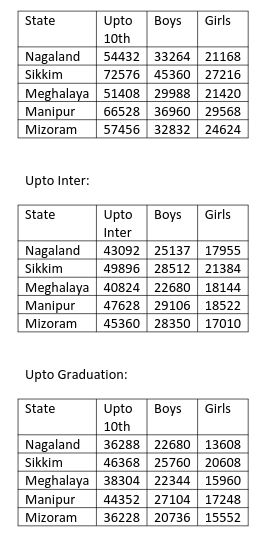
Q(1-5) Study the following Pie charts which show No of students studied up to 10th, Inter and Graduation and given the table to answer the following questions.
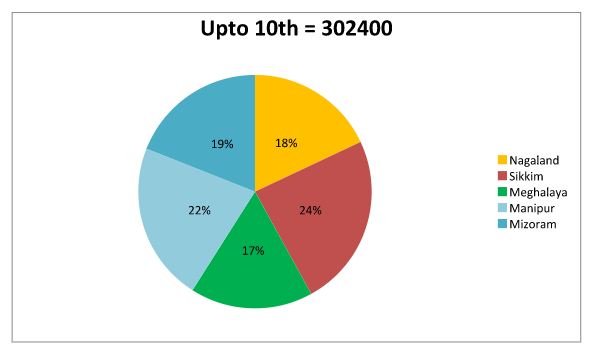
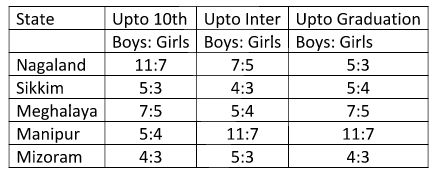
- Drop out girls from 10th to Inter in which state is highest?
A. Nagaland
B. Sikkim
C. Meghalaya
D. Manipur
E. MizoramD. Manipur

From above tables
Nagaland : 21168 – 17955 = 3213
Sikkim: 27216 – 21384 = 5832
Meghalaya: 21420 – 18144 = 3276
Manipur: 29568- 18522 = 11046
Mizoram: 24624- 17010 = 7614 - In which of the following State no of Graduate Boys is least?
A. Nagaland
B. Sikkim
C. Meghalaya
D. Manipur
E. MizoramE. Mizoram - What is the approximate Percentage dropouts from 10th studied Boys of Nagaland to Graduated Boys of Nagaland?
A. 16.77%
B. 25.33%
C. 31.81%
D. 40.18%
E. NoneC. 31.81%
Solution:
From above tables
33264-22680/33264*100 = 31.81% - In which of the following state highest no of Students up to Inter?
A. Nagaland
B. Sikkim
C. Meghalaya
D. Manipur
E. MizoramD. Manipur
Solution:
From above tables Manipur: 29106 - What is the average no of Girl students who studied up to Inter in all states together?
A. 17503
B. 17903
C. 18203
D. 18603
E. NoneD. 18603
Solution:
From above tables:
Average = 17955+21384+18144+18522+17010/5 = 18603
Q(6-10) Study the following Line Graph which shows no of employees in different roles in different companies based on that answer the following questions
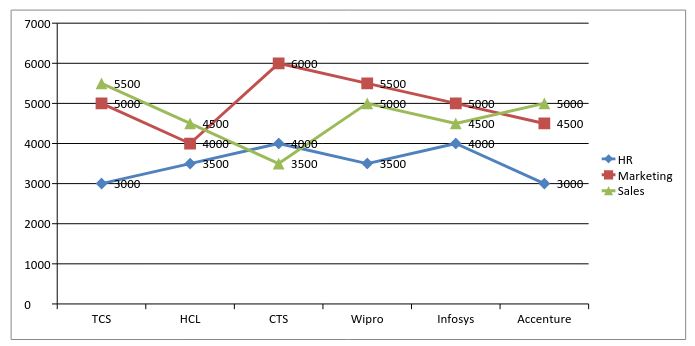
- What is the respective ratio of total no of HR’s to Marketing employees to Sales Employees in all companies together?
A. 21:25:23
B. 21:26:28
C. 21:25:28
D. 21:30:28
E. NoneD. 21:30:28
Solution:
HR’s = 3000+3500+4000+3500+4000+3000 = 21000
Marketing = 5000+4000+6000+5500+5000+4500 = 30000
Sales = 5500+4500+3500+5000+4500+5000 = 28000 - By what percent is the total no of employees working in HCL is less than the total no of employees in Wipro?
A. 11.39%
B. 12.22%
C. 13.16%
D. 14.28%
E. 15.98%D. 14.28%
Solution:
HCL = 4500+4000+3500 = 12000
Wipro = 5500+5000+3500 = 14000
% = 14000-12000/14000*100 = 14.28% - The no of Sales employees in CTS forms what percent of the total Sales employees in all companies together?
A. 10%
B. 12.5%
C. 15%
D. 20%
E. NoneB. 12.5%
Solution:
% = 3500/28000*100 = 12.5% - What is the ratio of total no of Employees in Accenture to total no of employees in Infosys?
A. 23:27
B. 25:26
C. 24:27
D. 25:27
E. NoneD. 25:27
Solution:
Accenture: 5000+4500+3000 = 12500
Infosys: 5000+4500+4000 = 13500
125:135 = 25:27 - In which of the following combination of companies total number of employees are equal?
A. TCS – HCL- Wipro
B. CTS- Infosys- Accenture
C. HCL – Wipro – Infosys
D. TCS- Infosys –CTS
E. NoneD. TCS- Infosys –CTS
Solution:
In TCS- Infosys – CTS = 13500
AffairsCloud Recommends Oliveboard Mock Test
AffairsCloud Ebook - Support Us to Grow
Govt Jobs by Category
Bank Jobs Notification
