

Gist about Economic Survey: –
Economic Survey of India is an annual document presented by the Ministry of Finance, Government of India.
The Department of Economic Affairs, Ministry of Finance presents the Survey in the Parliament every year, just before the Union Budget. It is prepared under the guidance of the Chief Economic Adviser of India.
The first Economic Survey of India was presented in 1950-51 as part of the Union Budget. After 1964 it was separated from the Budget and presented each year during the Budget Session before the presentation of the budget.
–Economic Survey 2020-2021
On the first day of Budgetary session i.e. January 31, 2020, Union Minister Nirmala Sitharaman, Ministry of Finance has presented the Economic Survey 2020-21 in the parliament
Author of Survey: It was authored by Chief Economic Adviser Krishnamurthy Venkata Subramanian, Ministry of finance.
Focus of Survey: #SavingLives&Livelihoods & #VshapedRecovery.
–Economic survey 20-21 is split into two volumes:
Volume I – to provide evidence based economic analyses of the challenges of policymaking and tools to make it more effective.
Volume II – reviews recent developments in the major sectors of the economy with a focus on the challenges faced due to the pandemic this year.
–Four-Pillar Strategy
India adopted a unique four-pillar strategy of
- Containment,
- Fiscal,
- Financial and
- Long-term structural reforms.
–Key Takeaways:
–The Economic Survey 2020-2021 is dedicated to the COVID-19 Warriors.
–It is the first time since independence that the economic survey is presented in paperless form, i.e. in ebook format on advice from health experts amid COVID-19.
V shaped recovery:
The Indian economy will see a “V-shaped” recovery driven by COVID-19 vaccination programme. While there was a 23.9 per cent contraction in GDP in Q1, the recovery has been a V-shaped one as seen in the 7.5 per cent decline in Q2 and the recovery across all key economic indicators.
- Key indicators such as Services Purchasing Managers’ Index, Air passenger traffic, rail freight traffic, port traffic, foreign tourist arrivals and foreign exchange are showing a V-shaped recovery.
- In order to boost industrial production, incentivize manufacturing and enhancing India’s exports, the Government of India has introduced the Production-Linked Incentive (PLI) Scheme in the 10 key sectors under the aegis of Atmanirbhar Bharat.
- The response by India also drew on epidemiological and economic research, especially those pertaining to the Spanish Flu, which highlighted that an early, intense lockdown provided a win-win strategy to save lives, and preserve livelihoods via economic recovery in the medium to long-term.
Gross Domestic Product (GDP) Projections:
–Future Projections:
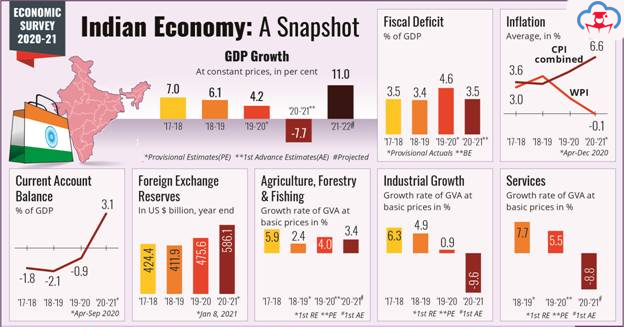
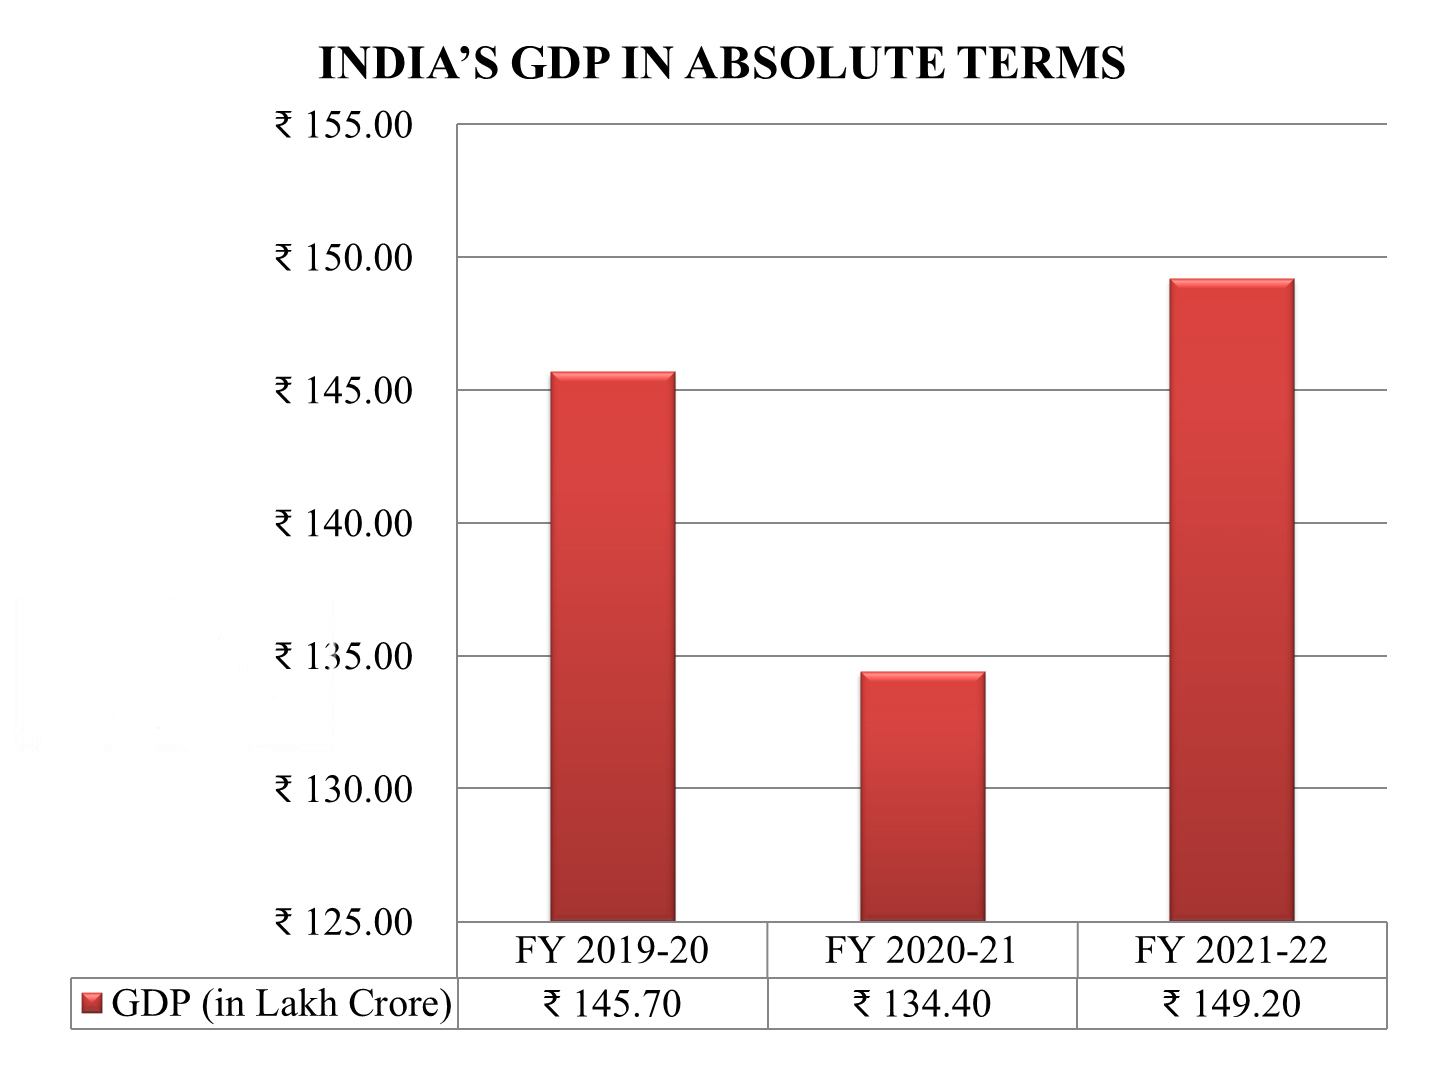
India’s economy to contract by 7.7%( -7.7%) in FY2020-2021. Meanwhile, it is also forecasted that India’s real GDP 11% and nominal GDP at 15.4% will grow highest since independence in FY21-22. The absolute value of GDP in 2021-22 is estimated as 149.20 Lakh crore rupees.
- It is expected that the economy will grow at a rate of 6.5% in 2022-23 and 7% in 2023-24 aided by structural reforms and will become the fastest growing economy in the next two years. In the worst-case scenario of 8% nominal annual growth, 3.8% real growth until FY29.
- Real GDP projection FY21 is based on the lines of MoSPI (Ministry of Statistics and Programme Implementation) estimates while real GDP of FY22 is based on IMF (International Monetary Fund) estimates. These projections are close to IMF estimate of real GDP growth of 11.5 per cent in 2021-22 for India and 6.8 per cent in 2022-23.
- Global economic output estimated to fall by 3.5% in 2020 (IMF January 2021 estimates)
This path would entail a growth in real Gross Domestic Product (GDP) by 2.4% over the absolute level of 2019-20 – implying that the economy would take two years to reach and go past the pre-pandemic level.
Gist about Indian Economy:
Current Account Surplus:
- India’s current account will register a surplus of 2% of GDP in FY21 after a gap of 17 years.
- Of the major sectors, only agriculture and allied activities are expected to grow by 3.4% resulting in an increase in its share in GDP to 19.9% in 2020-21 from 17.8 per cent in 2019-20.
- The combined (Centre and States) social sector expenditure as per cent of GDP has increased in 2020-21 compared to last year. The expenditure on social services (education, health and other social sectors) by Centre and States combined as a proportion of GDP increased from 7.5% in 2019-20 (RE) to 8.8% in 2020-21 (BE).
Fiscal Deficit:
As of January 8, 2021 the union government had borrowed (fiscal deficit) a total of Rs 10.72 lakh crore, which was 65% more than FY20. On the other hand, state governments had borrowed a total of Rs 5.71 lakh crore which was 41% more than FY20.
- As of January 20, 2021, the government earned Rs 15,220 crore through disinvestment route or around 7.2% of the targeted amount Rs 2.1 lakh crore. The disinvestment route means selling its stake in public sector enterprises.
- The focus of the Government is to embark on a significant privatisation exercise of Central Public Sector Enterprises (CPSEs) such as Air India, Bharat Petroleum Corporation Limited (BPCL), Container Corporation of India (CONCOR) and Shipping Corporation of India (SCI).
Gross Value Added:
GVA growth is pegged at -7.2% in 2020-21 as against 3.9% in 2019-20.
Consumer Price Index:
CPI inflation averaged 6.6% in 2020-21 (April-Dec) and stood at 4.6% in Dec 2020. Overall it has increased from 6.7% in 2019-20 to 9.1% in 2020-21.
Gross tax revenue:
CTR earned by the government during the period April to November 2020 fell by 12.6% to Rs10.26 lakh crore. For the year, it is also expected to fall short of the budgeted Rs 24.2 lakh crore.
— As of January 1, 2021 bank credit growth stood at 6.7%.
Service Sector:
Service sector are estimated to contract by 8.8% during FY21.
- The utilities sector will show positive growth of 2.7% in FY21.
- Among Services Sector, trade, hotels, transport & communication are estimated to contract by 21.4%(-21.4%).
— Capital expenditure during the last three months of 2020 recorded growth of 129% in October, 249% in November and 62% in December.
Healthcare Sector: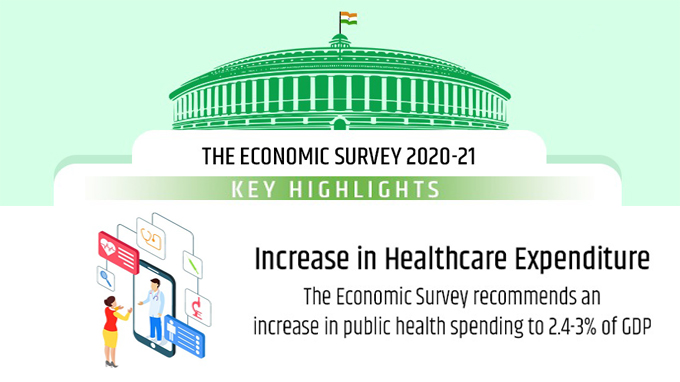 Healthcare Spend
The survey recommended that an increase in health spend from 1% to 2.5-3% of GDP can decrease the out-of-pocket (OOP) expenditure from 65% to 30% of the overall health care spend.
- According to National Health Accounts, 2017, 66 per cent of spending on healthcare is done by the states. India ranks 179th out of 189 countries in prioritization accorded to health in its government budgets (consolidated union & state government).
Covid-19 and India’s healthcare policy
As per the economic survey, 71% of global deaths and about 65% of deaths in India are caused by non-communicable diseases (NCDs). On quality and access of healthcare, India was ranked 145th out of 180 countries according to the Global Burden of Disease Study 2016.
- An improvement is also required on metrics of maternal mortality ratio (MMR) and infant mortality rate (IMR).
- At 3-4%, the hospitalization rates in India are among the lowest in the world as compared to middle-income countries (8-9%) and 13-17% for Organisation for Economic Co-operation and Development (OECD) countries.
Density of Health Workers:
As per World Health Organization (WHO), an aggregate density of health workers is to be 44.5 per 10,000 population.
- In India, the states of Kerala and Jammu and Kashmir have a high density of doctors.
- The states of Punjab, Himachal Pradesh (HP) and Chhattisgarh have a larger number of nurses and midwives but a very low density of doctors.
- Andhra Pradesh (AP), Delhi and Tamil Nadu have better balance of doctors and nurses and midwives.
Impact of PMJAY on Health Outcomes
Pradhan Mantri Jan Arogya Yojana (PMJAY), an ambitious program and a crucial component of the Ayushman Bharat Yojana, launched by Government of India in 2018, to provide healthcare access to the most vulnerable sections, has had a strong positive impact on the healthcare outcomes of those States that have adopted the healthcare scheme.
- The proportion of households with any usual member covered under health insurance or financing scheme increased by 54% in the states that adopted PMJAY, it decreased by 10% in the states that did not adopt PMJAY
- There is also reduction in Infant Mortality Rate (IMR) was 20% vis-à-vis 12% in PMJAY and non-PMJAY states respectively, an increment of 8 per cent for states that adopted PMJAY versus those that did not.
Agriculture and allied Sector: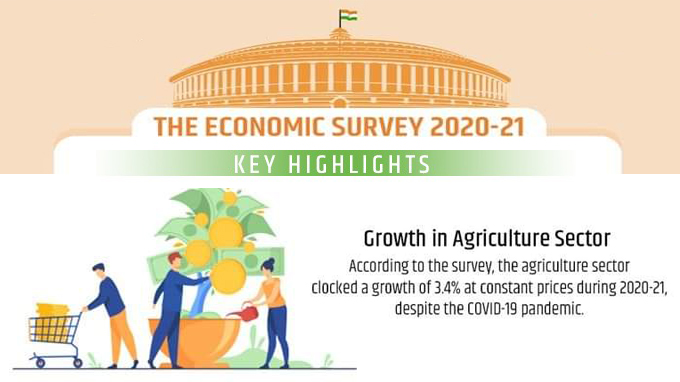 As per the Provisional Estimates of National Income released by Central Statistics Office (CSO)on 29th May, 2020, the share of Agriculture and Allied Sectors in Gross Value Added (GVA) of the country at current prices is 17.8 per cent for the year 2019-20.
- India’s agricultural and allied exports amounted to approximately Rs. 252 thousand crores. The major export destinations were USA, Saudi Arabia, Iran, Nepal and Bangladesh.
- Pradhan Mantri Fasal Bima Yojana (PMFBY) is a milestone initiative to provide a comprehensive risk solution at the lowest uniform premium across the country for farmers.
- PM-KISAN – An amount of 18000 crore have been deposited directly in the bank account of 9 crore farmer families of the country in December, 2020 in the 7th instalment of financial benefit under the PM-KISAN scheme.”
- Contribution of livestock in total agriculture and allied sector GVA (at Constant Prices) has increased from 24.32 per cent (2014-15) to 28.63 per cent (2018-19).
- Food Processing Industries (FPI): sector has been growing at an Average Annual Growth Rate (AAGR) of around 9.99 per cent as compared to around 3.12 per cent in Agriculture and 8.25 per cent in Manufacturing at 2011-12 prices during the last 5 years ending 2018-19.
- Fish production: in India has reached an all-time high of 14.16 million metric tons during 2019-20.
During the Financial Year 2020-21, allocation of food grains has been done through two channels- under National Food Security Act (NFSA) and Pradhan Mantri Garib Kalyan Anna Yojana (PM-GKAY) scheme.
In 2019-20 (according to fourth advance estimates), The total food grain production (296.65 million tonnes) in the country was higher by 11.44 million tonnes than 2018-19.
Innovation and Business:
India ranked 48th in 2020 Global Innovation Index, as it was the first time entered into top 50 innovating countries by improving its rank from 81 in 2015 to 48 in 2020.India ranks first in Central and South Asia.
- India’s gross expenditure on R&D at 0.7 per cent of GDP much lower than that of the top 10 economical countries spends around (1.5%-3% of GDP). The survey observes that GERD should be increased to over 2% of GDP by enhancing research and development facilities, especially in the private sector.
- Currently, the government sector contributes 56% of the total GERD, which is higher than the contribution of the government sector (20%) in top ten economies (such as China, United Kingdom, and Japan).
- India to become an Innovation leader, its residents’ share in total patents applications filed in the country must rise from the current level of 36%, at a CAGR of 9.8% to reach the top 10 economies by 2030.
- It highlighted the total R&D contribution needs to be scaled from the present level of 30% and 34% personnel of researches respectively, to 58% and 53% respectively.
- India being the second largest green bond market among the emerging markets after China. In 2017, to give push to Green Bonds issuances in India, SEBI issued guidelines on green bonds including listing of green bonds on the Indian stock exchanges. As of 24th December, 2020, eight ESG mutual funds have been launched in India.
India’s initiatives in Global level: –
- The Survey mentions the initiatives taken by India at the global stage to foster the sustainable model of development and have disaster resilient infrastructure at the disposal of citizens:
- International Solar Alliance (ISA) has recently launched two new initiatives – a ‘World Solar Bank’ and ‘One Sun One World One Grid Initiative’ – of global import to bring about solar energy revolution globally.
- The ISA Secretariat has recently launched a ‘Coalition for Sustainable Climate Action’ comprising of global public and private corporates. It has also organized First World Solar Technology Summit (WSTS) in September 2020 with an objective of showcasing to Member Countries the state of the art and next-generation solar technologies.
Industrial and Infrastructure
- The industrial sector is estimated to decline by 9.6% in 2020-21. Within the sector, highest decline is estimated in construction (12.6%) and mining (12.4%). The contribution of the industrial sector to GVA has declined from 32.5% in 2011-12 to 25.8% in 2020-21.
- The Index of Industrial Production (IIP) growth declined by 15.5% between April-November 2020 as compared to growth of 0.3% during same period in 2019. IIP is a measure of industrial performance that assigns a weight of 78% to manufacturing, 14% to mining, and 8% to electricity. Out of 407 items in IIP, the number of items which observed growth increased from 28 in April 2020 to 171 in November 2020, thereby, indicating a sharp economy recovery.
- The National Infrastructure Pipeline (NIP) was launched with an investment plan of Rs 111 lakh crore over five years (2020-25). The project is aimed at increasing growth, competitiveness, and employment. The state governments, central government, and the private sector will invest 40%, 39%, and 21% in the project, respectively. The major share of the funds will be given to: (i) energy sector (24%), (ii) roads (18%), (iii) urban infrastructure (17%), and (iv) railways (12%).
India’s oil production falls by 6%, gas by 5% in FY 20
India is the third-largest energy consumer in the world after the United States (US) and China but it’s oil production fell by 6% amid COVID-19. It’s indigenous crude oil production declined to 32.17 Million Metric Tonnes (MMT) in FY20 as against 34.20 million metric tonnes in FY19.
- Natural Gas production also saw a drop of 5% during FY20, at 31.18 Billion Cubic Meters (BCM) as against 32.87 BCM in FY19. During April-December 2020, gas production was 21.13 billion cubic metres which was 11.3% lower than FY20.
- In the April-December period of FY 2021, overall consumption of all petroleum products has fallen by 12.6% but has recovered to 87.2% of the consumption.
- Production of refinery products has fallen by 13.5% during April-December FY21.
Monetary policy & Banks:
Reserve Bank of India (RBI) undertook various conventional and unconventional measures like Open Market Operations (OMO), Long Term Repo Operations, Targeted Long Term Repo Operations etc. to manage liquidity situation in the economy.
Monetary policy transmission: – repo rate has been cut by 115 bps since March 2020 in first & second Monetary Policy Committee (MPC) meeting.
Banking Sector:
- Credit growth of banks slowed down to 6.7% as on January 1, 2021.
- Gross Non-Performing Assets (NPAs) ratio of Scheduled Commercial Banks (SCBs) decreased from 8.21% at the end of March 2020 to 7.49% at the end of September 2020.
- Capital to risk-weighted asset ratio of SCBs increased from 14.7% to 15.8% between March 2020 and September 2020
- Amid COVID-19, the initiation of Corporate Insolvency Resolution Process (CIRP) was suspended for any default arising on or after March 25, 2020 for a period of 6 months. This was further extended twice for 3 months on September 24, 2020 and December 22, 2020.
- Nifty 50 and S&P BSE Sensex reached record high closing of 14,644.7 and 49,792.12 on January 20, 2021 respectively.
- According to the Pre Budget-Survey, the recovery rate for the Scheduled Commercial Banks through IBC (since its inception) has been over 45 per cent.
Regulatory Forbearance
- Regulatory forbearance for banks involved relaxing the norms for restructuring assets, where restructured assets were no longer required to be classified as Non-Performing Assets (NPAs henceforth) and therefore did not require the levels of provisioning that NPAs attract.
- Forbearance should be discontinued when the economy exhibits recovery, not to be continued for years.
- Asset Quality Review exercise must be conducted immediately after the forbearance is withdrawn.
- Legal infrastructure for the recovery of loans need to be strengthened.
Fiscal Development
A combination of demand and supply side policies under the ambit of ‘Aatma Nirbhar Bharat’ to cushion against the pandemic shock, and subsequently fuel the economic recovery.
- Fiscal Deficit for 2019-20 Provisional Actuals stood at 4.6% of GDP, which was 1.2% points higher than Fiscal deficit in 2018-19. Fiscal Deficit for 2020-21 BE (Budget Estimates) stood at 3.5% of GDP.
- The effective Revenue Deficit increased by 1% of GDP to reach 2.4% of GDP in 2019-20 PA relative to 2018-19.
- As a percentage of GDP, the anticipated growth of total expenditure in 2020-21 BE over 2019-20 PA is 0.3 % of GDP with growth equivalent to 0.15 % of GDP each in both Revenue and capital expenditure.
- As per the Survey, “the average Gross Fiscal Deficit Budget Estimate for States that presented their budgets before the outbreak of COVID-19 was 2.4 per cent of GSDP, while the average for budgets presented post-lockdown was 4.6 per cent of GSDP.
Debt Sustainability
The economic survey examines the optimal position of fiscal policy in India during a crisis and concludes that growth itself leads to debt stability, but not vice versa.
This is because debt sustainability depends on the “Interest Rate Growth Rate Differential” (IRGD) i.e. the difference between the interest rate and the growth rate in an economy.
Sovereign Credit Ratings
Sovereign credit ratings methodology to be made more transparent, less subjective and better attuned to reflect an economy’s fundamentals.
- India has zero sovereign default history.
- India’s sovereign credit rating is currently rated as BBB-/Baa3
- India’s sovereign external debt as per cent of GDP stood at a mere 4% as of September 2020.
- India’s fiscal policy should not be restrained by biased and subjective ratings; rather it should focus on growth and development
Thalinomics: The cost of a plate of food in 2020-21
There was wide variation in states related to Thali costs between June-December, 2020.
Rural Areas:
- The most expensive Veg thali in the rural areas was in Andaman & Nicobar Islands (Rs 38.7) while the cheapest in rural areas was in Uttar Pradesh (Rs 23.1).
- In terms of Non-Veg thali, the most expensive was in Arunachal Pradesh (Rs 48.5) while cheapest was in Chandigarh (Rs 29.9) in rural areas.
Urban Areas:
- The most expensive Veg thali in the urban areas was in Andaman & Nicobar Islands (Rs 40.0) while the cheapest was in Madhya Pradesh (Rs 24.0).
- In terms of Non-Veg thali during the same period, the most expensive was in Mizoram (Rs 52.4) while cheapest was in Haryana (Rs 28.0) in urban areas.
The Story of Exports:
As of on January 8, 2021, the foreign exchange reserves rose to an all-time high of $ 586.1 billion due to the various initiatives undertaken to promote exports, including Production Linked Incentive (PLI) Scheme, Remission of Duties and Taxes on Exported Products (RoDTEP), improvement in logistics infrastructure and digital initiatives would go a long way in strengthening external sector in general and exports in particular.
- The exports of gems and jewellery, engineering goods, textile and allied products declined but the exports of drugs and pharma, software and agriculture and allied products improved.
- In 2019-20, India’s agricultural and allied exports amounted to approximately Rs. 252 thousand crores. The major export destinations were United States of America (USA), Saudi Arabia, Iran, Nepal and Bangladesh. The top agriculture and related products exported from India were marine products, basmati rice, buffalo meat, spices, non-basmati rice, cotton raw, oil meals, sugar, castor oil and tea.
Employment & Unemployment:
In accordance with the Centre for Monitoring Indian Economy (CMIE), an estimated 121 million jobs amid lockdown. India’s unemployment rate is estimated at 23.52% in April, 2020 and 21.73% in May, 2020 and over 10% in June, 2020.
- As per the Data from periodic labour force survey (PLFS), urban employment in India in the January-March quarter 2020 stood at 9.1%, higher than 7.9% in the preceding quarter.
- The net payroll data of Employees’ Provident Fund Organisation (EPFO) as on 20th December, 2020 shows a net increase of new subscribers in EPFO of 78.58 lakhs in 2019-20 as compared to 61.1 lakhs in 2018-19.
- The size of the labour force increased by about 0.85 crore between 2017-18 and 2018-19.
- Reduction in statutory rate of contribution from 12% to 10% for wage months May, June and July, 2020 for all class of establishments covered under the EPF & MP Act, 1952 was announced as part of Atmanirbhar Bharat package.
- Under Prime Minister’s Garib Kalyan Package (PMGKP) financial assistance was given to building & other construction workers (BOCW) which largely included migrant workers from the funds collected under BOCW’s cess. 31 State/UT Governments have announced cash benefits, ranging from Rs. 1000 to Rs. 6000 per month to around 2.0 crore workers and total amount of Rs. 4973.65 crore was disbursed.
Unemployment rates at all India level, for all ages, as per usual status, declined marginally to 5.8 per cent in 2018-19 from 6.1 per cent in 2017-18.
Allocation to Rural Jobs programme highest ever at Rs1.1 tn
In the Budget for 2020-21, the Centre had allocated Rs 61,500 crore to the rural jobs programme. But an additional allocation of Rs 40,000 crore to the rural jobs scheme by the Central Government helped in 311.92 crore person-days under the Mahatma Gandhi National Rural Employment Guarantee Scheme (MGNREGS).
- Wages under MGNREGA were increased by Rs 20 from Rs182 to Rs 202 w.e.f. 1st April, 2020, which would provide an additional amount of Rs 2000 annually to a worker.
- Also Aatmanirbhar Bharat Rojgar Yojana (ABRY) was launched in November 2020 with an estimated outlay of Rs 22,810 crore for the labourers who lost jobs amid COVID-19. The scheme will remain in force up to wage month 31st May, 2023.
- It should be noted that agriculture is the largest employer with 42.5% of workforce in 2018-19 i.e. 21.5 crore persons.
Bare Necessities
“Basic needs” approach to economic development focuses on minimum specified quantities of basic necessities such as food, clothing, shelter, water and sanitation that are necessary to prevent ill health and under nourishment. Bare Necessities Index (BNI) is an attempt to quantify this approach to economic development using data from National Statistical Office (NSO). It is created for all States/Union Territories by employing data at State Level.
Bare Necessities Index (BNI):
Economic Survey 2020-21 presented a Bare Necessities Index (BNI) at the rural, urban and all India level. The BNI summarizes 26 indicators on five dimensions viz., water, sanitation, housing, micro-environment, and other facilities. It has been created for all States for 2012 and 2018 using data from two National Statistical Office (NSO) rounds viz., 69th and 76th on Drinking Water, Sanitation, Hygiene and Housing Condition in India.
- Access to drinking water to households in most of the States has improved in 2018 compared to 2012 in rural as well as urban areas.
- There is also an improvement in micro environment for all States in 2018 except for Assam in rural and Odisha and Assam in urban areas as compared to 2012.
Education &Online Schooling:
To mitigate the effect of COVID-19, Rs. 818.17 crore is allotted to States/UTs to promote online learning through digital initiatives and Rs.267.86 crore for online teacher training under Samagra Shiksha Scheme.
MANODARPAN initiative for psychological support has been included in Atma Nirbhar Bharat Abhiyan.
Around 92 courses have started and 1.5 crore students are enrolled under Swayam MOOCs (Massive Online Open Courses).
PM eVIDYA which is a comprehensive initiative to unify all efforts related to digital/online/on-air education.
PRAGYATA guidelines on digital education have been developed with a focus on online/blended/digital education for students who are presently at home due to closure of schools.
The government announced the new National Education Policy (NEP), 2020 replacing the 34-year-old National Policy on Education, 1986.
The Survey states that India has attained a literacy level of almost 96% at the elementary school level. As per National Sample Survey (NSS), the literacy rate of persons of age 7 years and above at the All-India level stood at 77.7%.
As per the Annual Status of Education Report (ASER) 2020 Wave-1 (Rural), released in October 2020, the percentage of enrolled children from government and private schools owning a smartphone increased enormously from 36.5% in 2018 to 61.8% in 2020 in rural India.
Skill Development:
The Economic Survey 2020-21 states that only 2.4 % of the workforce of age 15-59 years has received formal vocational / technical training and another 8.9% of the workforce received training through informal sources. Following are measures taken by government to upgrade skill development:
- The Unified Skill Regulator- National Council for Vocational Education and Training (NCVET) was operationalized.
- The Awarding and Assessment Bodies’ Guidelines were notified in October, 2020 for more credible certifications and assessments.
- Pradhan Mantri Kaushal Vikas Yojana 3.0 was rolled out in 2020-21 with a tentative target to skill 8 lakh candidates including migrants.
Economic Growth to Alleviate Poverty
- Economic Survey 2020-21 observes in India, “Economic growth has a far greater impact on poverty alleviation than inequality”. Economic growth has been represented by income per capita at the state level.
- The growth stories of India and China have shown a significant reduction in poverty due to high economic growth.
- The Economic Survey 2020-21 thus concludes that focus on policy of growth does not imply that the redistributed objectives are unimportant, but that redistribution is only feasible in a developing economy if the size of the economic pie grows.
Note: India’s rank in HDI (Human Development Index) 2019 was recorded 131 compared to 129 in 2018, out of a total 189 countries.
India’s Services sector
Services sector accounts for 48% of total exports and it has outperformed goods exports in the recent years. Service sector accounting for over 54% of India’s Gross Value Addition (GVA) and nearly four-fifths of total FDI inflow into India. The sector’s share in Gross State Value Added exceeds 50% in 15 out of 33 States and UTs, and is particularly more pronounced in Delhi and Chandigarh.
Contact-intensive services sector contracted by nearly 16% during the first half of the financial year 2020-21.
World Investment Report 2020 – India has also improved its position from 12th in 2018 to 9th in 2019 in the list of world’s largest FDI recipients.
FDI equity inflows into India’s services sector grew robustly by 34% Y-o-Y during April-September 2020 to reach US$ 23.6 billion.
Computer Software & Hardware sub-sector, where FDI inflows grew by over 336%.
Shipping turnaround time at ports has almost halved from 4.67 days in 2010-11 to 2.62 days in 2019-20.
IT-BPM Services: Telecom related regulations were removed from IT-BPM sector and consumer protection regulations were introduced for e-commerce. The IT-BPM Industry has also embraced recent policy reforms, such as relaxation of OSP guidelines and New Umbrella Entity, to drive greater innovation and efficiency.
Space Sector:
India’s space sector has grown exponentially in the past six decades. India spent about US$ 1.8 billion on space programmes in 2019-20.
Foreign Investments in India:
As a result of strong inflows, buoyant Sensex and Nifty resulted in India’s market-capitalisation to Gross Domestic Product (GDP) ratio crossing 100 per cent for the first time since October 2010.
Foreign Portfolio Investment (FPI):
- India was the only country among emerging markets to receive equity inflows from FPIs in 2020, as the country attracted USD 30 billion in the first nine months of the year, Emerging markets like Indonesia, Malaysia, South Korea, Taiwan, Philippines, Brazil, Thailand and South Africa witnessed outflows
- Net inflows from foreign portfolio investors (FPIs) recorded an all-time monthly high of USD 9.8 billion in November 2020, The total cumulative investment by FPIs (at the acquisition cost) increased 5.4 per cent to USD 273.6 billion as on December 31, 2020 from USD 259.5 billion as on December 31, 2019
- Net FPI inflows of US$ 28.5 billion during April-December, 2020 as against US$ 12.3 billion in corresponding period of last year
Foreign Institutional Investor (FII):
During April-December 2020, equities witnessed an inflow of at USD 30 billion, five times its previous year value – India was the only country among emerging markets to receive equity FII inflows in 2020
Foreign Direct Investment (FDI):
- FDI equity inflows were US$49.98 billion in FY20 as compared to US$44.37 billion during FY19, it is US$30.0 billion for FY21 (up to September-2020)
- The bulk of FDI equity flow is in the non-manufacturing sector Within the manufacturing sector, industries like automobile, telecommunication, metallurgical, non-conventional energy, chemical (other than fertilizers), food processing, petroleum & natural gas got the bulk of FDI
- Net FDI inflows of US$ 27.5 billion during April-October, 2020: 14.8% higher as compared to first seven months of FY2019-20
India and the Sustainable Development Goals (SDGs):
India has taken several proactive steps to mainstream the SDGs into the policies, schemes and programmes of the Government.
- Voluntary National Review (VNR) presented to the United Nations High-Level Political Forum (HLPF) on Sustainable Development provides for review and follow-up of the SDGs
- Localisation of SDGs: States and UTs have created discrete institutional structures for implementation of SDGs in their own specific contexts.
Climate Change –
- India has been taking several proactive climate actions to fulfil its obligations as per the principles of common but differentiated responsibilities and respective capabilities and equity.
Some of the prominent government initiatives on mitigation and adaptation actions such as India’s National Action Plan on Climate Change (NAPCC), Jawaharlal Nehru National Solar Mission (JNNSM), Climate Change Action Plan (CCAP), National Adaptation Fund on Climate Change and implementation of Faster Adoption and Manufacturing of (Hybrid &) Electric Vehicle in India (FAME India) scheme.
Sustainable Climate Finance
- National Voluntary Guidelines for Responsible Financing, finalized in 2015, are financial sector-specific guidelines that combine and adapt international and national best practices.
- RBI included lending to social infrastructure and small renewable energy projects within the priority sector targets.
- ‘Voluntary Guidelines on Corporate Social Responsibility’ were issued in 2009 to mainstream the concept of business responsibility.
- Committee was constituted to review and update the Business Responsibility Reporting (BRR)formats for listed as well as unlisted companies.
- Click Here for Official Survey


