

Hello Aspirants. Welcome to Online Quantitative Aptitude section in AffairsCloud.com. Here we are creating question sample FromData Intrepretation that is important for all the competitive exams. We have included Some questions that are repeatedly asked in exams !!
I.Study the following graph and table carefully to answer the given questions.
Profit earned by 3 companies over the years
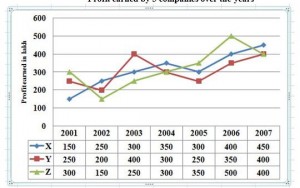
- What is the average profit earned by all the 3 companies in the year 2004 ?
A)Rs.317lakh
B)Rs.265lakh
C)Rs.267lakh
D)Rs.342lakh
E)None of theseAnswer – A)Rs.317lakh
Explanation :2004 = 350+300+300/3 = 316.66 = 317 - In which of the following year was the total profit earned by all three companies together the maximum ?
A)2002
B)2004
C)2005
D)2007
E)None of theseAnswer – D)2007
Explanation :
2002 = 600
2004 = 950
2005 = 900
2007 = 1250 - In which of the following years was the maximum difference between the profits earned by Company Y and Company Z ?
A)2001
B)2003
C)2006
D)Both 2003 and 2006
E)None of theseAnswer – D)Both 2003 and 2006
Explanation :
2001 = 50
2002 = 50
2003 = 150
2004 = 0
2005 = 100
2006 = 150
2007 = 0 - What was the approximate % increase in the profit earned by Company X from 2003 to 2007 ?
A)15%
B)20%
C)25%
D)50%
E)None of theseAnswer – D)50%
Explanation :% = [(450 – 300)/300]*100 = 50% - What is the ratio between the profit earned by Companies X and Y together in 2002 to profit earned by Companies Y and Z in 2005 ?
A)4:3
B)3:4
C)2:3
D)4:1
E)None of theseAnswer – B)3:4
Explanation :
2002 = 450
2005 = 600
45 : 60 = 9:12 = 3:4
II.Study the following graph carefully to answer the given questions.
Number of people using electronic devices from various cities
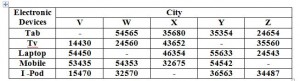
- If the no of people used Tab in the city V is 75% of the people using mobile in the city Y .Find the average no of people using Tab in all the cities together ?
A)38232
B)43213
C)34576
D)31787
E)None of theseAnswer – A)38232
Explanation :
Tab V = 75*54542/100 = 40906.5 = 40907
Tab total = 191161/5 = 38232 - What is the ratio between the no of people using Tv and and I – pod in the city X ,no of people using I – pod in the city X is 2/5 th of the no of people using tab in the city W ?
A)36:25
B)12:8
C)2:1
D)7:3
E)None of theseAnswer –C)2:1
Explanation :
X = Tv : I-pod = 43652 : 21826 = 2:1
I – pod = 2/5(54565) = 21826 - What is the difference between the total no of people using all electronic devices in the city W and city Z ?(No of people using laptop in the city W and no of people using mobile in the city Z are equal to no of people using TV in the city X)
A)32550
B)40834
C)46804
D)28656
E)None of theseAnswer – C)46804
Explanation :
W = 209700
Z = 162896
Difference = 46804 - No of people using I-pod is what % of the people using mobile in the city V,W and Z together ?
A)54.5%
B)65.8%
C)34.7%
D)73.7%
E)None of theseAnswer – A)54.5%
Explanation :
Mobile = 151440
I – pod = 82527
% = 82527*100/ 151440 = 54.49% = 54.5% - Which city has the highest no of people using Mobile ?
A)V
B)W
C)X
D)Y
E)ZAnswer – D)Y
AffairsCloud Recommends Oliveboard Mock Test
AffairsCloud Ebook - Support Us to Grow
Govt Jobs by Category
Bank Jobs Notification
