

Hello Aspirants. Welcome to Online Quantitative Aptitude section in AffairsCloud.com. Here we are creating question sample From Data Intrepretation that is important for IBPS,SBI exam,SSC exam, Railways Exam,FCI exam and other competitive exams. We have included Some questions that are repeatedly asked in exams !!
I. Study the following graph to answer the given questions
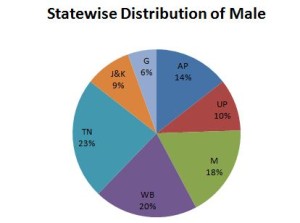
Total population 39lak
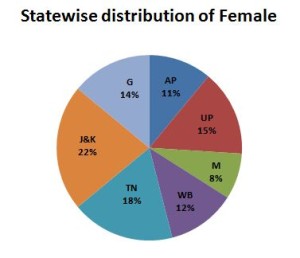
Total population 32lak
- What is the ratio between the Female population of state UP and the male population of M?
A)60:95
B)80:117
C)85:112
D)45:77
E)None of theseB)80:117
Explanation :
F = 32*15/100 = 4.8lak
M = 39*18/100 = 7.02lak
480:702 = 80:117 - What is the total population of State J & K ?
A)11.55lak
B)10.65lak
C)10.55lak
D)9.78lak
E)None of theseC)10.55lak
Explanation :
M = 39*9/100 = 3.51lak
F = 32*22/100 =7.04lak
Total = 10.55 = 10.55lak - Find the difference between Male population and Female population in the state WB ?
A)5.76lak
B)4.67lak
C)3.69lak
D)3.96lak
E)None of theseD) 3.96lak
Explanation :
M = 39*20/100 = 7.8lak
F = 32*12/100 = 3.84
Diff = 7.8 – 3.84 = 3.96lak - Find the average number of males in all the 7 states ?
A)5lak
B)6lak
C)5.57lak
D)6.57lak
E)None of theseC)5.57lak
Explanation :
AP = 39*14/100 = 5.46lak
UP = 39*10/100 = 3.9lak
M = 39*18/100 = 7.02lak
WP = 39*20/100 = 7.8llak
TN = 39*23/100 = 8.97lak
J & K = 39*9/100 = 3.51lak
G = 39*6/100 = 2.34lak
Avg = 38.99/7 = 5.57lak - The angle corresponding to the female population in the states AP and M ?
A)56.9degree
B)76.5degree
C)48.6degree
D)68.4degree
E)None of theseD)68.4degree
Explanation :
AP + M = 11+8 = 19%
Angle = 19*360/100 = 68.4degree
II. Study the following graph to answer the given questions
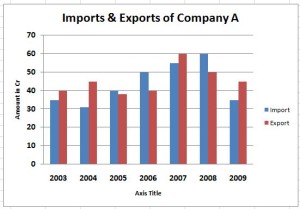
2003 2004 2005 2006 2007 2008 2009
35 31 40 50 55 60 35 I
40 45 38 40 60 50 45 E
- What is the ratio of total imports to the total exports for all the given years ?
A)53:51
B)51:53
C)46:68
D)15:17
E)None of theseB)51:53
Explanation :
Import = 35+31+40+50+55+60+35 = 306
Export = 40+45+38+40+60+50+45 = 318
I : E = 306 : 318 = 51:53 - During which year the % of imports rise compared to the previous year is maximum?
A)2007 – 08
B)2006 – 07
C)2003 – 04
D)2004 – 05
E)None of theseD)2004 – 05
Explanation :
2003-04 = [31 – 35/35]*100 = fall
2004 -05 = [40 – 31/31]*100 = 29.03%
2005-06 = [50 – 40/40]*100 = 25%
2006-07 = [55 – 50/50]*100 = 10%
2007-08 = [60 – 55/55]*100 = 9.09%
2008-09 = [35 – 60/60]*100 = fall - What is the percentage increase in the export from 2004 – 07 ?
A)33.33%
B)35%
C)23.65%
D)45%
E)None of theseA)33.33%
Explanation :% = (60 – 45/45)*100 = 33.33% - Find the average imports for the years 2003, 2006 and 2009 ?
A)25
B)65
C)40
D)45
E)None of theseC)40
Explanation :35+50+35/ 3 = 40 - The total exports in the year 2005,2006 and 2009 together are what % of the total imports during the same period ?
A)98.4%
B)94.8%
C)96.5%
D)86.6%
E)None of theseA)98.4%
Explanation :
E = 38+40+45 = 123
I = 40+50+35 = 125
123*100/125 = 98.4%
AffairsCloud Recommends Oliveboard Mock Test
AffairsCloud Ebook - Support Us to Grow
Govt Jobs by Category
Bank Jobs Notification
