Hello Aspirants. Welcome to Online Quantitative Aptitude section in AffairsCloud.com. Here we are creating question sample From Data Intrepretation that is important for IBPS,SBI exam,SSC exam, Railways Exam,FCI exam and other competitive exams. We have included Some questions that are repeatedly asked in exams !!
Click here to View Quantitative Aptitude Quiz Page
Click here to View DI SET 1
Click here to View DI SET 2
Click here to View DI SET 3
Click here to View DI SET 4
Click here to View DI SET 5
Click here to View DI SET 6
Click here to View DI SET 7
Click here to View DI SET 8
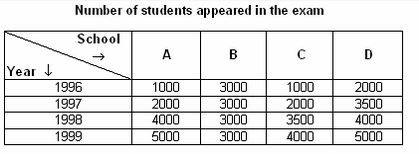
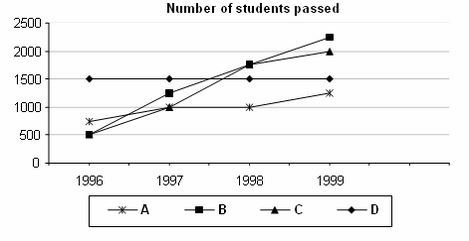
Directions for questions : These questions are based on the following table and the line graph. The table gives the number of students, who appeared in the annual exams from four schools A, B, C and D, through the period 1996 to 1999 and the line graph gives the number of students who passed from these schools in these exams for the given period.


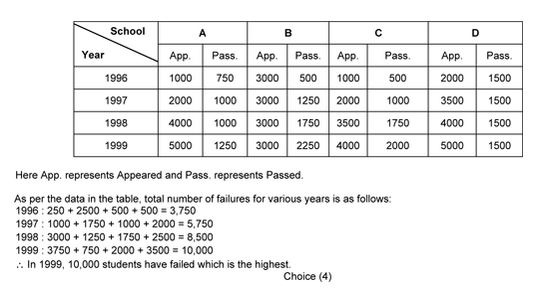
- During__________year was the total number of students who failed from the schools A, B, C and D together, the highest?
1 : 1996
2 : 1997
3 : 1998
4 : 1999
5 : Cannot be determined4 : 1999
- What is the pass percentage of school A in 1998?
1 : 50%
2 : 40%
3 : 25%
4 : 60%
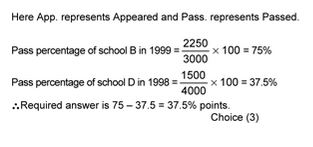
5 : None of these3 : 25% pass % of school A in 1998 = 1000/4000 x 100 = 25% - If percentage points is defined as the difference between two percentage values, by how many percentage points is the pass percentage of school B in 1999 more than that of school D in 1998?
1 : 25
2 : 25.56
3 : 37.5
4 : 50
5 : None of these3 : 37.5
- From school C, totally how many students have passed in all the years from 1996 to 1999?
1 : 4750
2 : 6000
3 : 5250
4 : 3750
5 : None of these3 : 5250 - Which school has the highest pass percentage for any of the years from 1996 to 1999?
1 : B
2 : A ,C
3 : A and B
4 : D
5 : A, B and D5 : A, B and D


