Hello Aspirants.
Welcome to Online Quantitative Aptitude section in AffairsCloud.com. Here we are creating question sample From Data Interpretation that is important for all the competitive exams. We have included Some questions that are repeatedly asked in exams.
Bank PO Level Questions :-
I. Answer the questions based on the given line graph.
Ratio of exports to imports of two companies over the years.

- In how many of the given years were the exports more than the imports for company A?
A. 2
B. 3
C. 4
D. 5
E. None of theseAnswer – B. 3
Explanation :
The exports more than the imports for company A in 3 years, 2005,2006,2007. - If the imports of company A in 2007 were increased by 40%, what would be the ratio of exports to the increased imports?
A. 1.20
B. 1.25
C. 1.30
D. Can not be determined
E. None of the AboveAnswer – B. 1.25
Explanation :
Let export of the company A in 2007 = 175x
import of the company A in 2007 = 100x
New import of the company A in 2007 = 140% of 100x = 140x
New Ratio = 175x/140x = 1.25 - If the exports of company B in 2008 were Rs.237 crore, what was the amount of imports in that year?
A. 189.6 crore
B. 243.8 crore
C. 281.5 crore
D. 316.7 crore
E. None of the AboveAnswer – A. 189.6 crore
Explanation :
Let imports of company B in 2008 = x crore
237/x = 1.25 => x = 189.6 - In 2005, the export of company A was double that of company B. If the imports of company A during the year was Rs 180 crores, what was the approximate amount of imports profit company B during that year?
A. 190 crore
B. 210 crore
C. 225 crore
D. Can not be determined
E. None of the AboveAnswer – B. 210 crore
Explanation :
In 2005, for company A => Export / 180 = 1.75
Export of company A = 1.75 * 180
Export of company B = 1.75 * 180 / 2 = 157.5
Import of company B = 157.5/0.75 = 210 crore - In which year were the exports of company A minimum proportionate to its imports?
A. 2010
B. 2009
C. 2008 and 2010
D. 2005 and 2007
E. None of the AboveAnswer – B. 2009
Explanation :
The exports of company A minimum proportionate to its imports refers the minimum ratio.Ans: 2008 and 2009.From the options ans is 2009
II. Study the following Pie-Chart carefully to answer the questions that follow
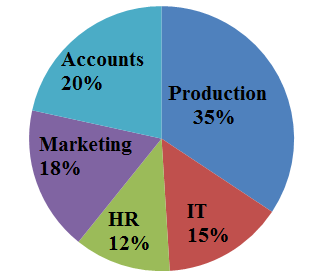
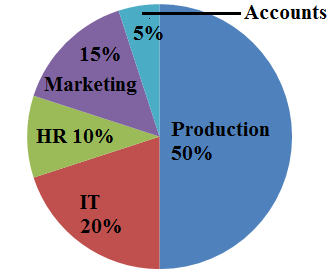
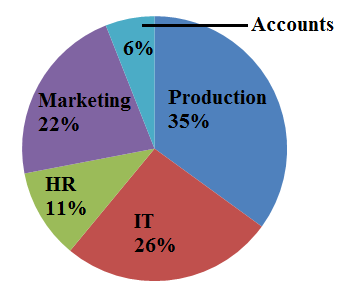
Breakup of number of employees working in different departments of an organisation. the number of males and the number of employees who recently got promoted in each department.
Breakup of employees working in different departments
Total number of employees = 3600

Breakup number of males in each department
Total number of male employees = 2040

Breakup number of employees who recently got promoted in each department
Total number of employees who got promoted = 1200

- The number of employees who got promoted from HR department was what percent of the total employees working in that department?(rounded off to two digits after decimal).
A. 36.18%
B. 30.56%
C. 47.22%
D. 28.16%
E. None of the AboveAnswer – B. 30.56%
Explanation :
Number of employees who got promoted from HR department = 11% of 1200 = 132
Number of working employees in HR department = 12% of 3600 = 432
Required Percentage = (132/432)*100 = 30.56% - The total number of employees who got promoted from all the departments together was what percent of the total number of employees working in all the department together?(rounded off to the nearest integer)
A. 56%
B. 21%
C. 45%
D. 33%
E. None of the AboveAnswer – D. 33%
Explanation :
Number of promoted employees in all departments = 1200
Number of working employees in all departments = 3600
% = (1200/3600)*100 = 33% - What is the total number of females working in the production and marketing departments together?
A. 468
B. 812
C. 582
D. 972
E. None of the AboveAnswer – C. 582
Explanation :
Total number of employees working in the production and marketing departments together = 53% of 3600 = 1908
Total number of male employees working in the production and marketing departments together = 65% of 2040 = 1326
Total number of female employees working in the production and marketing departments together = 1908 – 1326 = 582 - If half of the member of employees who got promoted from the IT department were males, what was the approximate percentage of males who got promoted from the IT Department?
A. 61%
B. 29%
C. 54%
D. 38%
E. None of the AboveAnswer – D. 38%
Explanation :
Number of promoted employees in IT department = 26% of 1200 = 312
Number of promoted male employees in IT department = 312/2 = 156
Number of working male employees in IT department = 20% of 2040 = 408
% = (156/408 * 100) = 38% - How many females work in the accounts department?
A. 618
B. 592
C. 566
D. 624
E. None of the AboveAnswer – A. 618
Explanation :
Number of employees working in accounts department = 20% of 3600 = 720
Number of male employees in accounts department = 5% of 2040 = 102
Number of females work in the accounts department = 720 -102 = 618


