

Hello Aspirants. Welcome to Online Quantitative Aptitude section in AffairsCloud.com. Here we are creating question sample From Data Intrepretation that is important for IBPS,SBI exam and other competitive exams. We have included Some questions that are repeatedly asked in exams !!
Click here to View Quantitative Aptitude Quiz Page
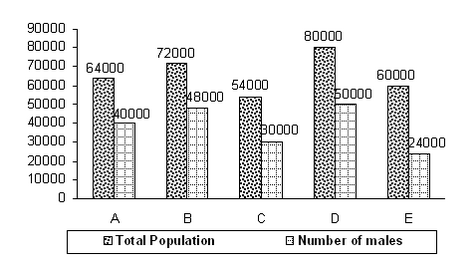
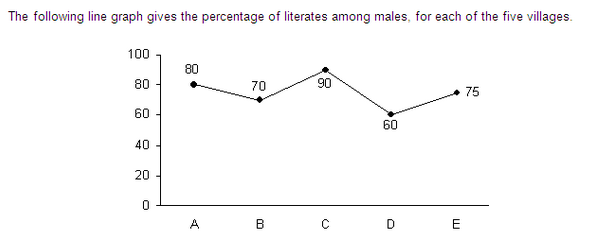
Directions: These questions are based on the following bar graph and line graph. The following bar graph gives the total population of five villages and the number of males in each of the five villages.
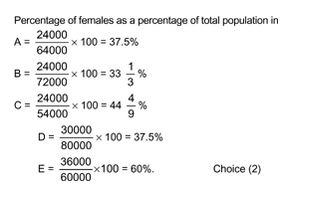
- In which village is the number of females as a percentage of the total population, the lowest?
1 : A
2 : B
3 : C
4 : D
5 : E2 : B

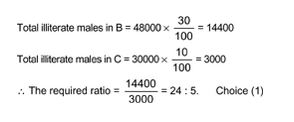
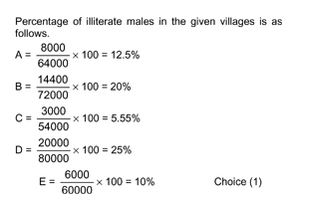
- What is the ratio of the number of illiterate males in B to that in C?
1 : 24 : 5
2 : 7 : 16
3 : 9 : 13
4 : 11 : 19
5 : None of these1 : 24 : 5

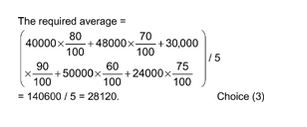
- What is the average number of literate males per village?
1 : 32240
2 : 24420
3 : 28120
4 : 29430
5 : None of these3 : 28120

- In how many villages is the number of illiterate males, as a percentage of the total population, more than 21%?
1 : 1
2 : 2
3 : 3
4 : 4
5 : None of these1 : 1

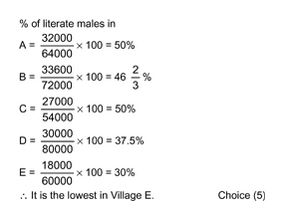
- In which village is the number of literate males, as a percentage of the total population, the lowest?
1 : A
2 : D
3 : B
4 : C
5 : E5 : E

AffairsCloud Recommends Oliveboard Mock Test
AffairsCloud Ebook - Support Us to Grow
Govt Jobs by Category
Bank Jobs Notification
