

On July 4, 2019, The Union Minister for Finance and Corporate Affairs, Smt. Nirmala Sitharaman presented the Economic Survey 2018-19. It was prepared by the Chief Economic Advisor Krishnamurthy Subramanian. The Survey forecasts a growth rate of 7 per cent for FY20, as compared to the growth rate of 6.8 per cent in FY19.It had a cover page in skyblue colour as it adopts an unfettered approach in thinking about the appropriate economic model for India.
Highlights of the Economic Survey 2018-19
Private Investment as the Key Driver of Growth, Jobs, Exports and Demand
- As per the Economic Survey 2019, the pathways for drop opened up in the last five years; and benefits of growth and macroeconomic stability reached to the bottom.
- Sustained real Gross Domestic Product (GDP) growth rate of 8% is needed for a $5 trillion economy by 2024-25.
- Virtuous Cycle of savings, investment and exports supported by a favorable demographic phase is required for sustainable growth.
- Private investment is the key driver for demand, capacity, labor productivity, new technology, creative destruction and job creation.
- Survey views the economy as being either in a virtuous or a vicious cycle, and never in equilibrium.
Behavioral Economics of “Nudge”
- Decisions by real people deviate from impractical robots theorized in classical economics and Behavioral economics provides insights to ‘nudge’ people towards desirable behavior.
- Use of the following insights from behavioral economics will help to create an aspirational agenda for social change:
- From ‘Beti Bachao Beti Padhao’ to ‘BADLAV’ (Beti Aapki Dhan Lakshmi Aur Vijay Lakshmi).
- From ‘Swachh Bharat’ to ‘Sundar Bharat’.
- From ‘Give it up” for the LPG subsidy to ‘Think about the Subsidy’.
- From ‘Tax evasion’ to ‘Tax compliance’.
Reorienting policies for MSME Growth
- Survey focused on enabling MSMEs (Micro, Small & Medium Enterprises) to grow for achieving greater profits, job creation and enhanced productivity.
- Dwarfs (firms with less than 100 workers) despite being more than 10 years old, account for more than 50% of all organized firms in manufacturing by number. Contribution of dwarfs to employment is only 14% and productivity is a mere 8%.
- Large firms (more than 100 employees) account for 75% employment and close to 90% of productivity despite accounting for about 15% by number.
- Survey also focused on service sectors such as tourism, with high spillover effects on other sectors such as hotel & catering, transport, real estate, entertainment etc., for job creation.
Ending Matsyanyaya to Ramp up Capacity in the Lower Judiciary
- Delays in contract enforcement and disposal resolution are the single biggest hurdle to the ease of doing business and higher GDP growth in India. There are around 87.5% of pending cases are in the District and Subordinate courts.
- 100% clearance rate can be achieved by filling out the 2279 vacancies in the lower courts and 93 in High Courts.
- States of Uttar Pradesh, Bihar, Odisha and West Bengal need special attention. Productivity improvements of 25% in lower courts, 4% in High Courts and 18% in Supreme Court can clear backlog.
Effect of economic policy uncertainty on Investment
Uncertainty dampened investment growth in India for about five quarters. Survey proposed a reduction in economic policy uncertainty by way of:
- Consistency of actual policy with forward guidance.
- Quality assurance certification of processes in Government departments.
India’s Demography at 2040; Increase in retirement age
- Sharp slowdown in population growth expected in next 2 decades.
- National Total Fertility Rate expected to be below replacement rate by 2021.
- Working age population to grow by roughly 9.7mn per year during 2021-31 and 4.2mn per year during 2031-41.
- Significant decline to be witnessed in elementary school-going children (5-14 age group) over the next two decades. States need to consolidate/merge schools to make them viable rather than build new ones.
- Policy makers need to prepare for ageing by investing in health care and by increasing the retirement age in a phased manner.
Analysis of the Swachh Bharat Mission(SBM)
- 93.1% of households have access to toilets.
- 96.5% of those with access to toilets are using them in rural India.
- 100% Individual Households Latrine (IHHL) Coverage in 30 states and Union Territories.
- Financial savings from a household toilet exceeded the financial costs to the household by 1.7 times on average and 2.4 times for the poorest households.
- Environmental and water management issues need to be incorporated in SBM for sustainable improvements in the long-term.
Enabling Inclusive Growth through Affordable, Reliable and Renewable Energy
- 2.5 times increase in per capita energy consumption needed for India to increase its real per capita GDP by $5000 at 2010 prices, and enter the upper-middle income group.
- 4 times increase in per capita energy consumption needed for India to achieve 0.8 Human Development Index score.
- India now stands at 4th in wind power, 5th in solar power and 5th in renewable power installed capacity. The cumulative renewable power installed capacity (excluding hydro above 25 MW) was more than doubled from 35 GW on 31st March, 2014 to 78 GW on 31st March, 2019. The target is to achieve an installed capacity of renewable based power of 175 GW by the year 2022.
- Rs 50,000 crore saved and 108.28 million tonnes of Carbon dioxide emissions reduced by energy efficiency programmes in India.
- Share of renewable (excluding hydro above 25 MW) in total electricity generation increased from 6% in 2014-15 to 10% in 2018-19.
- Thermal power still plays a dominant role at 60% share.
- Market share of electric cars only 0.06% in India while it is 2% in China and 39% in Norway.
MGNREGS (Mahatma Gandhi National Rural Employment Guarantee Act)
- Survey says that efficacy of MGNREGS was increased with the use of technology in streamlining it.
- Significant reduction in delays in the payment of wages with adoption of National Electronic Fund Management System (NeFMS) and Direct Benefit Transfer (DBT) in MGNREGS.
- Demand and supply of work under MGNREGS increased, especially in distressed districts.
- Vulnerable sections of the society viz. women, SC and ST workforce increased under MGNREGS during economic distress.
Redesigning Minimum Wage System
- Survey proposed a well-designed minimum wage system as a potent tool for protecting workers and alleviating poverty. 1 in every 3 wage workers in India are not protected by the minimum wage law.
- Survey supports rationalization of minimum wages as proposed under the Code on Wages Bill.
- ‘National Floor Minimum Wage’ should be notified by the Central Government, varying across five geographical regions.
- Minimum wages by states should be fixed at levels not lower than the ‘floor wage’ either on the skills or on geographical region or on both grounds.
- Present minimum wage system in India has 1,915 minimum wages for a variety of scheduled job categories across states.
- Survey proposed a simple and enforceable Minimum Wage System using technology.
- ‘National level dashboard’ under the Ministry of Labour & Employment for regular notifications on minimum wages, proposed by the Survey.
 State of the Economy
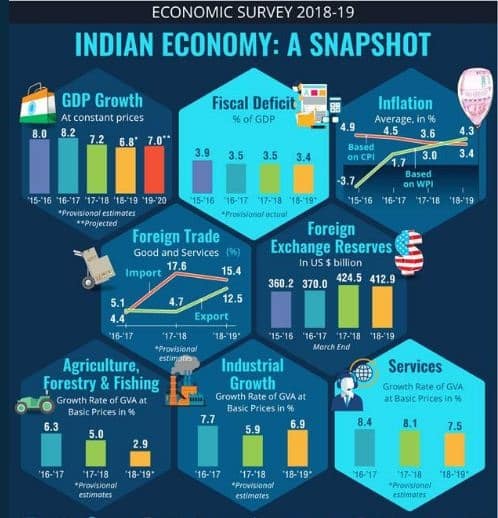
- India was still the fastest growing major economy in 2018-19.
- Growth of GDP moderated to 6.8% in 2018-19 from 7.2% in 2017-18.
- Inflation contained at 3.4% in 2018-19.
- Non-Performing Assets (NPA) as a percentage of Gross Advances reduced to 10.1% at end December 2018 from 11.5% at end March 2018.
- Growth in fixed investment picked up from 8.3% in 2016-17 to 9.3% in 2017-18 and further to 10% in 2018-19.
- Current Account Deficit (CAD) manageable at 2.1% of GDP.
- Fiscal deficit of the Central Government declined from 3.5% of GDP in 2017-18 to 3.4% in 2018-19.
- India’s foreign exchange reserves are placed at $422.2 billion in June 2019.
- The survey projects GDP to grow at 7% in 2019-20.
Fiscal Developments
- FY 2018-19 ended with fiscal deficit at 3.4% of GDP and debt to GDP ratio of 44.5% (Provisional).
- As per cent of GDP, total Central Government expenditure fell by 0.3% points in 2018-19 p.a over 2017-18- 0.4% point reduction in revenue expenditure and 0.1% point increase in capital expenditure.
- The revised fiscal glide path envisages achieving fiscal deficit of 3% of GDP by FY 2020-21 and Central Government debt to 40% of GDP by 2024-25.
- General Fiscal Deficit was pegged at 5.8% in FY 2018-19.
Money Management and Financial Intermediation
- Banking system improved as NPA ratios declined and credit growth accelerated.
- Insolvency and Bankruptcy Code led to recovery and resolution of significant amount of distressed assets and improved business culture.
- Till March 31, 2019, the CIRP (Corporate Insolvency Resolution Process) yielded a resolution of 94 cases involving claims worth Rs 1, 73,359 crore.
- As on 28 Feb 2019, 6079 cases involving Rs 2.84 lakh crores have been withdrawn.
- As per RBI reports, Rs 50,000 crore received by banks from previously non-performing accounts.
- Additional Rs 50,000 crore “upgraded” from non-standard to standard assets.
- Benchmark policy rate first hiked by 50 bps and later reduced by 75 bps last year.
- Liquidity conditions remained systematically tight since September 2018 thus impacting the yields on government papers.
- Financial flows remained constrained because of the decline in the equity finance raised from capital markets and stress in the NBFC (Non-Banking Financial Sector) sector.
- Capital mobilized through public equity issuance declined by 81% in 2018-19.
- Credit growth rate year-over-year (YOY) of the NBFCs declined from 30% in March 2018 to 9% in March 2019.
Prices and Inflation
- Headline inflation based on Consumer Price Index – Combined (CPI-C) continuing on its declining trend for fifth straight financial year remained below 4.0% in the last two years.
- Food inflation based on Consumer Food Price Index (CFPI) also declined for fifth financial year, remained below 2.0% for the last two consecutive years.
- Miscellaneous, housing and fuel and light groups are the main contributors of headline inflation based on CPI-C during FY 2018-19.
- CPI rural inflation declined during FY 2018-19 over FY 2017-18.
Sustainable Development and Climate Change
- India’s SDG Index Score ranges between 42 and 69 for States and between 57 and 68 for UTs.
- Kerala and Himachal Pradesh are the front runners with a score of 69 amongst states. Chandigarh and Puducherry are the front runners with a score of 68 and 65 respectively among the UTs.
- Namami Gange Mission was launched for achieving the SDG (Sustainable Development Goal) 6 with a budget outlay of Rs 20,000 crore.
- A comprehensive National Clean Air Programme (NCAP) was launched in 2019 as a pan India time bound strategy for prevention, control and abatement of air pollution.
External Sector
- As per WTO (World Trade Organization), World trade growth slowed down to 3% in 2018 from 4.6% in 2017.
- India’s External Debt was $521.1 billion at end-December 2018, 1.6% lower than its level at end-March 2018.
- The total liabilities-to-GDP ratio, inclusive of both debt and non-debt components, has declined from 43% in 2015 to about 38% at the end of 2018.
- The Indian Rupee traded in the range of 65-68 per US$ in 2017-18 but depreciated to a range of 70-74 in 2018-19.
- Composition of India’s exports and import basket in 2018-19(P):
- Exports (including re-exports): Rs 23, 07,663 Cr.
- Imports: Rs 35, 94,373 Cr.
- Top export items continue to be Petroleum products, precious stones, drug formulations, gold, and other precious metals.
- Top import items continue to be Crude petroleum, pearl, precious, semi-precious stones and gold.
- India’s main trading partners continue to be the US, China, Hong Kong, the UAE, and Saudi Arabia.
- India has signed 28 bilateral/multilateral trade agreements with a various country/group of countries. In 2018-19,
- Exports to these countries stood at US$121.7 billion accounting for 36.9% of India’s total exports.
- Imports from these countries stood at US$266.9 billion accounting for 52% of India’s total imports.
Agriculture and Food Management
- Gross Value Added (GVA) in agriculture improved from -0.2% in 2014-15 to 6.3% in 2016-17 but decreased to 2.9% in 2018-19.
- Gross Capital Formation (GCF) in agriculture declined to 15.2% in 2017-18 as compared to 15.6% in 2016-17.
- Women’s participation in agriculture increased to 13.9% in 2015-16 from 11.7% in 2005-06.
- 89% of groundwater extracted is used for irrigation.
- Policies should focus on Dairying as India is the largest producer of milk; Livestock rearing; Fisheries sector as India is the second largest producer.
Industry and Infrastructure
- India’s ranking improved by 23rd to 77th position in 2018 among 190 countries assessed by the World Bank Doing Business (DB) Report 2019.
- Road construction grew at 30 km per day in 2018-19.
- Rail freight and passenger traffic grew by 5.33% and 0.64% respectively in 2018-19.
- Total telephone connections in India touched 118.34 crores in 2018-19. The telecom industry’s contribution to GDP is estimated to reach 8.2% by 2020.
- Public-Private Partnerships (PPP) are ideal for addressing infrastructure gaps.
- Building sustainable and resilient infrastructure was given due importance with programmes such as SAUBHAGYA (Pradhan Mantri Sahaj Bijli Har Ghar Yojana ) scheme, PMAY (Pradhan Mantri Awas Yojana) etc.
- To achieve the target of USD 10 trillion economy size by 2032, a robust and resilient infrastructure system is required, supported by adequate private investments.
Services Sector
- The services sector contributed more than half of the Gross Value Added (GVA) growth in 2018-19.
- IT-BPM (Information Technology- Business Process Management) industry grew by 8.4% in 2017-18 to $167 billion.
- The services sector growth declined marginally to 7.5% in 2018-19.
- The sectors that saw growth were Financial services, real estate and professional services.
- The sectors that saw decline were Hotels, transport, communication and broadcasting services.
Social Infrastructure, Employment and Human Development
- Government expenditure on Health increased to 1.5% in 2018-19 from 1.2% in 2014-15.
- Government expenditure on Education increased to 3% in 2018-19.
- Affordable and quality healthcare being provided through National Health Mission and Ayushman Bharat scheme.
- Substantial progress in both quantitative and qualitative indicators of education was reflected in the improvements in Gross Enrolment Ratios, Gender Parity Indices and learning outcomes at primary school levels.
- Net employment generation in the formal sector was higher at 8.15 lakh in March, 2019 as against 4.87 lakh in February, 2018 as per Employees’ Provident Fund Organisation (EPFO).
- Around 1, 90, 000 km of rural roads constructed under Pradhan Mantri Gram Sadak Yojana (PMGSY) since 2014.
- About 1.54 crore houses completed under Pradhan Mantri Awas Yojana (PMAY) as against a target of 1 crore pucca houses with basic amenities by 31st March, 2019.
Smart City Mission
The Survey showed that projects worth over Rs 2.05 lakh crore are proposed in 100 cities under the Smart Cities Mission and significant progress has been made in terms of implementation of these projects.
About Economic Survey:
Economic Survey is an annual document prepared by the government reviewing the economic developments over the past year.


