The National Sample Survey Office (NSSO), Ministry of Statistics and Programme Implementation (MoSPI), Government of India (GoI), in its 78th round survey, carried out the ‘Multiple Indicator Survey (MIS)’ for the 1st time to cater the requirements of various national indicators of SDGs (Sustainable Development Goals).
- The key findings of the survey have been incorporated into a report titled ‘Report on Multiple Indicator Survey, 2020–21″ (NSS Report No. 589).
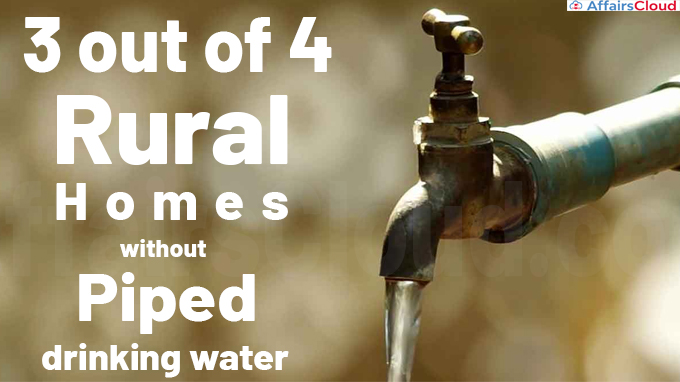
According to the ‘Multiple Indicator Survey (MIS) – NSS 78th Round Report [2020-21]’, less than a quarter of rural households and less than two-thirds of urban households in India have piped water for drinking in their houses or yards.
- Around 70% of rural households reported having exclusive access to a latrine, whereas 21.3% reported having no access to a latrine, exclusive or otherwise.
- According to the survey, nearly half of rural households still use firewood as their primary source of energy for cooking.
Multiple Indicator Survey – NSS 78th Round Report [2020-21]
i.The NSSO conducted the MIS in its 78th cycle, which spanned the entire nation (except the villages of Andaman and Nicobar Islands), with the following objectives:
- To collect information for developing estimates of some important Sustainable Development Goal (SDG) indicators.
- To collect information Purchase/Construction of house(s)/ flat(s) by the household for residential purpose after 31.03.2014 and information on Migration
ii.The survey was originally scheduled to take place during January – December 2020, but the field work was delayed until August 15, 2021, due to the COVID-19 pandemic.
iii.The survey included 1. 6 lakh rural households and 1. 1 lakh urban households.
Some Key Findings of the Survey
| S.No | Item Description | Percentage (all-India) | ||
|---|---|---|---|---|
| Rural | Urban | All (Rural+Urban) | ||
| 1. | Percentage of persons reported to have improved source of drinking water | 95.0 | 97.2 | 95.7 |
| 2. | Percentage of persons reported access to improved latrine, among the persons who had reported access to latrine | 97.5 | 99.0 | 98.0 |
| 3. | Percentage of persons reported access to hand washing facility with water and soap/detergent within the premises | 77.4 | 92.7 | 81.9 |
| 4. | Percentage of households using clean fuel as primary source of energy for cooking | 49.8 | 92.0 | 63.1 |
| 5. | Percentage of persons of age 15-29 years were in formal and non-formal education and training for the 12 months preceding the survey | 33.0 | 39.4 | 34.9 |
| 6. | Percentage of persons of age 15-24 years not in education, employment or training (NEET) as on date of survey | 30.2 | 27.0 | 29.3 |
| 7. | Percentage of persons of age 18 years and above who used mobile telephone with active sim card during the three months preceding the date of the survey | 67.8 | 83.7 | 72.7 |
| 8. | Percentage of households in rural areas reported availability of all-weather roads within 2 km from the place of living | 92.5 | – | – |
| 9. | Percentage of households reported purchase/ construction of any new house/flat after 31.03.2014 | 11.2 | 7.2 | 9.9 |
| 10. | Percentage of households reported purchase/construction of new house/flat for the first time, among the households which reported purchase/construction of any new house/flat after 31.03.2014 | 47.5 | 57.9 | 49.9 |
| 11. | Percentage of persons having current place of residence different from the last usual place of residence | 26.8 | 34.6 | 29.1 |
Penetration of Piped Drinking Water
i.More than 95.7% of people reported having access to an “improved source of drinking water,” despite the poor penetration of piped drinking water in several states.
- Improved sources of drinking water included bottled water, piped water to dwellings, yards, or plots, piped water from neighbours, public taps on standpipes, tube wells, hand pumps, protected wells, public tanker trucks, private tanker trucks, protected springs, and rainwater collection.
ii.Assam, Jharkhand, Uttar Pradesh, Bihar, and Odisha are among the states with the worst access to tapped drinking water for both rural and urban households.
iii.Less than 90% of people in Kerala, Manipur, Nagaland, and Jharkhand have access to improved sources of drinking water.
Access to Sanitation
i.The lowest proportion of rural households with access to an exclusive toilet are found in Bihar, Jharkhand, and Odisha.
- More than 30% of households in the same three states lacked access to a latrine.
ii.The percentage of households with access to an exclusive toilet is higher than 60% for all other states.
- The improved latrine included flush/pour-flush to piped sewer system, flush/pour-flush to septic tank, flush/pour-flush to twin leach pits/single pit, ventilated improved pit latrine, pit latrine with slab, and composting latrine.
Primary Source of Energy for Cooking
i.Firewood is the primary source of energy for cooking in more than 70% of households in Chhattisgarh, Odisha, West Bengal, Nagaland, and Madhya Pradesh.
ii.Less than 25% of households in these states, along with Jharkhand, utilise Liquefied Petroleum Gas (LPG) for cooking, which is the lowest percentage of any state or Union Territory (UT).
iii.The primary source of energy is defined as the energy source that the household used the most of the time.
- The sources of clean cooking fuel are: (i) LPG, (ii) Other Natural Gas, (iii) Gobar Gas, (iv) Other Biogas, (v) Electricity (Including Generated by Solar/ Wind Power Generators) And (vi) Solar Cooker.
Education, Employment, Digital Literacy & Financial Inclusion
i.During the survey period, 16.1% of males and 43.8% of females aged 15-24 years, were not studying, working, or training.
ii.Less than 50 % of people who were aged 18 or above had exclusive access to mobile phones.
iii.Less than one-third of people in the 18+ age category in Jharkhand and Uttar Pradesh have exclusive access to mobile phones.
iv.The report confirms India’s progress in financial inclusion, with nearly 90% of those surveyed reporting having an account, either individually or jointly, with banks, other financial institutions, or mobile money service providers.
v.Among larger states, Uttarakhand, Odisha, Kerala, and Delhi seemed to have the highest proportion (more than 20%) of men aged 15 to 24 years with no formal education, employment, or training at the time of the survey.
- The proportion of females was highest in Uttar Pradesh, Assam, Odisha, Gujarat, West Bengal, and Bihar.
Recent Related News:
i.In February 2023, the NSSO released the 5th ‘Annual Report Periodic Labour Force Survey (PLFS)- July, 2021 – June, 2022’ stating Unemployment rate (UR) at 5-year low of 4.1% in 2021-22. It was 4.2% in July 2020-June 2021. The Pan-India UR for male was 4.4% and for women was 3.3% in July, 2021 – June, 2022.
ii.The Unemployment Rate (UR) under the ‘usual status’ during the one-year period declined for the fourth consecutive year since it was launched in April 2017.
About the Ministry of Statistics and Programme Implementation (MoSPI):
MoSPI is divided into two wings: Statistics and Programme Implementation.
i.The Statistics Wing – The National Statistical Office (NSO), which consists of the Central Statistical Office (CSO), the Computer center and the National Sample Survey Office (NSSO).
ii.The Program Implementation Wing is divided into three divisions:(i) Twenty Point Programme (ii) Infrastructure Monitoring and Project Monitoring and (iii) Member of Parliament Local Area Development Scheme.
Minister of State (Independent Charge) – Rao Inderjit Singh (Constituency- Gurugram, Haryana)


