


Hello Aspirants. Welcome to Online Quantitative Aptitude section in AffairsCloud.com. Here we are creating question sample From Data Intrepretation that is important for all the competitive exams. We have included Some questions that are repeatedly asked in exams !!
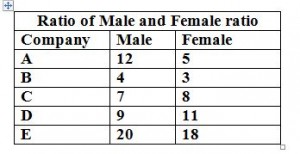
I.Study the following graph and table carefully to answer the given questions.
Number of employees working in 5 different Companies
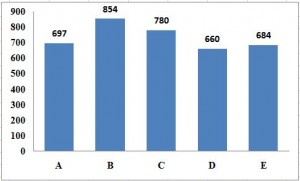


- What is the total number of male employee in all the companies together ?
A)2010
B)2001
C)2100
D)2140
E)None of these
Answer
B)2001
Explanation :
A = 697*12/17 = 492
B = 854*4/7 = 488
C = 780*7/15 = 364
D = 660*9/20 = 297
E = 684*20/38 = 360
Total = 492+488+364+297+360 = 2001
- What is the average number of female employee taking all the years together ?
A)432
B)278
C)384
D)335
E)None of these
Answer
D)335
Explanation :
A = 697 – 492 = 205
B = 854 – 488 = 366
C = 780 – 364 = 416
D = 660 – 297 = 363
E = 684 – 360 = 324
Avg = 205+366+416+363+324/5 = 1674/5 = 334.8 = 335
- What is the ratio of male and female employee working in companies D and E together ?
A)217:221
B)43:47
C)124:127
D)219:229
E)None of these
Answer
D)219:229
Explanation :
Male = D+E = 297+360 = 657
Female = D+E = 363+324 = 687
657:687 = 219 : 229
- By what % is the no of total employees of company C more than that of Company D ?
A)18.18%
B)16.75%
C)22.65%
D)7.25%
E)None of these
Answer
A)18.18%
Explanation :
C = 780
D = 660
% = (780-660)*100/660 = 18.18%
- By what % is the no of employees working in companies A and C more than that of female employees working in companies B and D ?
A)112.5%
B)96.2%
C)102.6%
D)124.5%
E)None of these
Answer
C)102.6%
Explanation :
A+C = 697+780 = 1477
Female B + D = 366+363 = 729
% = (1477-729)*100/729 = 102.6%
II.Study the following graph and table carefully to answer the given questions.
The pie-charts show the % of registration of different types of bikes in Mumbai and Delhi.Total no of bikes registered in Mumbai and Delhi is 15,000 and 35000
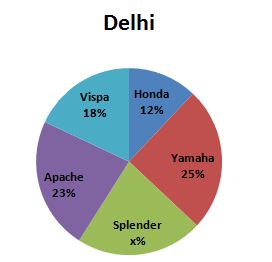
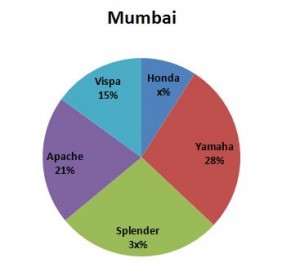


- If no of Honda bikes registered in Mumbai is half of the % of Vispa bikes registered in Delhi. Find the total number of Honda bikes registered in Mumbai and Delhi together ?
A)5500
B)5550
C)6050
D)4050
E)None of these
Answer
B)5550
Explanation :
Mumbai Honda = 18/2 = 9%
= 9*15000/100 = 1350
Delhi Honda = 12*35000/100 = 4200
Total = 1350+4200 = 5550
- Find the no of Splender bikes registered in Delhi ?
A)7700
B)5100
C)6500
D)4700
E)None of these
Answer
A)7700
Explanation :
Delhi Splender = 100 –(18+12+25+23)
= 100 – 78 = 22%
12% = 22*35000/100 = 7700
- Which of the following bikes registration has the maximum difference between Delhi and Mumbai ?
A)Splender
B)Yamaha
C)Apache
D)Vispa
E)None of these
Answer
C)Apache
Explanation :
Mumbai Delhi
Honda 9% = 1350 12% = 4200
Yamaha 28%=4200 25% = 8750
Splender 27%=4050 22% = 7700
Apache 21%=3150 23% = 8050
Vispa 15%=2250 18% = 6300
8050 – 3150 = 4900….Apache
- What is the ratio of no of Vispa bikes registered in Mumbai to the no of Yamaha bikes registered in Delhi ?
A)11:26
B)24:7
C)35:8
D)9:35
E)None of these
Answer
D)9:35
Explanation :V : Y = 2250 : 8750 = 225 : 875 = 9:35
- Which of the following bikes registered maximum in Mumbai ?
A)Apache
B)Honda
C)Yamaha
D)Splender
E)None of these
Answer
C)Yamaha
Note : Dear Friends if u know an alternate methods or shortcuts related to any chapter, you can share here.
AffairsCloud Recommends Oliveboard Mock Test
AffairsCloud Ebook - Support Us to Grow
Govt Jobs by Category
Bank Jobs Notification


