


Hello Aspirants.
Welcome to Online Quantitative Aptitude section in AffairsCloud.com. Here we are creating question sample From Data Interpretation that is important for IBPS, SBI, RRB,SSC and other competitive exams. We have included Some questions that are repeatedly asked in exams.
I. Study the following table carefully to answer the given Questions
The table gives the stock market data for 5 companies in the last 25 weeks
| Company | Current Market Price(Rs) | Last 25 weeks | |
| Highest Price(Rs) | Lowest Price(Rs.) | ||
| A | 129 | 356 | 114 |
| B | 325 | 760 | 200 |
| C | 543 | 1450 | 320 |
| D | 254 | 655 | 97 |
| E | 420 | 951 | 121 |
- The difference in the 25 weeks Highest & lowest price is highest for which of the following Company ?
1.A
2.C
3.E
4.B
5.None of these
Answer & Explanation
Answer – 2.C
Explanation :
A = 356-114 = 242
B = 760-200 = 560
C = 1450 – 320 = 1130
D = 655 – 97 = 558
E = 951-121 = 800
- How much % is the lowest Price of E is lower than the highest price of D (approximately) ?
1.82%
2.75%
3.88%
4.90&
5.None of these
Answer & Explanation
Answer – 1.82%
Explanation :
E lowest Price = 121
D highest Price = 655
% = 655-121/655 * 100 = 81.52 = 82%
- What is the % gain for B from 25 weeks lowest price to the current price ?
1.82.5%
2.73.6%
3.62.5%
4.55.7%
5.None of these
Answer & Explanation
Answer – 3.62.5%
Explanation :
Gain = 325-200/200 * 100
= 125*100/200 = 62.5
- Which of the following companies has lowest average market price ?(Average price is equal to average of high, low and current prices )
1.C
2.E
3.D
4.A
5.None of these
Answer & Explanation
Answer – 4.A
Explanation :
A = 129+356+114/3 = 199.7
B =325+760+200/3 = 428.3
C = 543+1450+320/3 = 771
D = 354+655+97 /3= 335.3
E = 420+951+121/3 = 497.3
- What is the total of highest price of all the five companies in the last 25 weeks ?
1.4172
2.3243
3.2342
4.5122
5.None of these
Answer & Explanation
Answer – 1.4172
Explanation :
Total = 356+760+1450+655+951 = 4172
II.Study the following graph carefully to answer the given Questions
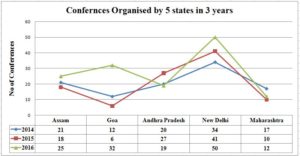

- How many conferences totally organised by five states in the year 2014 and 2015 ?
1.197
2.243
3.312
4.206
5.None of these
Answer & Explanation
Answer – 4.206
Explanation :
Total = (21+18) + (12+6) + (20+27) +( 34+41) + (17+10 )
= 39+18+47+75+27
= 206
- If the years are arranges in descending order of the total no of conferences organised by given states, which of the following would be the correct order ?
1.2014, 2015, 2016
2.2016, 2014, 2015
3.2016, 2015, 2014
4.2014, 2016, 2015
5.None of these
Answer & Explanation
Answer – 2.2016, 2014, 2015
Explanation :
2014 = 104
2015=102
2016 =138
- Approximately how much % increase in the no of conferences organised from 2014 to 2016 by Goa ?
1.126%
2.156%
3.176%
4.167%
5.None of these
Answer & Explanation
Answer – 4.167%
Explanation :
% = 32-12/12 * 100 = 167%
- What is the average no of conferences organised by the state Andhra Pradesh in all the three years ?
1.22
2.18
3.20
4.32
5.None of these
Answer & Explanation
Answer – 1.22
Explanation :
AP Avg = 20+27+19 /3 = 22
- What is the difference between the no of conferences organised by New Delhi in 2016 to no of conferences organised by Maharashtra in 2014 ?
1.35
2.29
3.33
4.27
5.None of these
Answer & Explanation
Answer – 3.33
Explanation :
New Delhi 2016 = 50
Maharashtra 2014 = 17
Diff = 50 – 17 = 33
AffairsCloud Recommends Oliveboard Mock Test
AffairsCloud Ebook - Support Us to Grow
Govt Jobs by Category
Bank Jobs Notification


