


Hello Aspirants.
Welcome to Online Quantitative Aptitude section in AffairsCloud.com. Here we are creating question sample From Data Intrepretation that is important for all the competitive exams. We have included Some questions that are repeatedly asked in exams.
Bank PO Level Questions :-
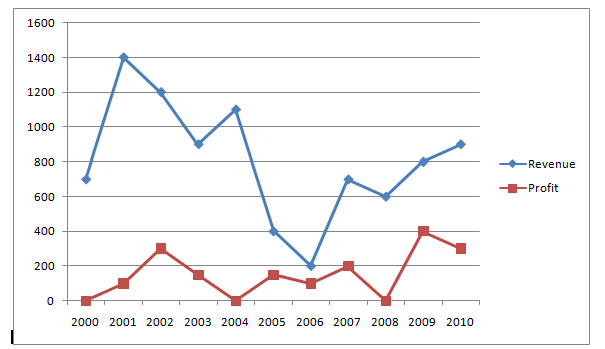
I. Answer the following questions, based on the following two graphs, assuming that there is no fixed component and all the units produced are sold in the same year.
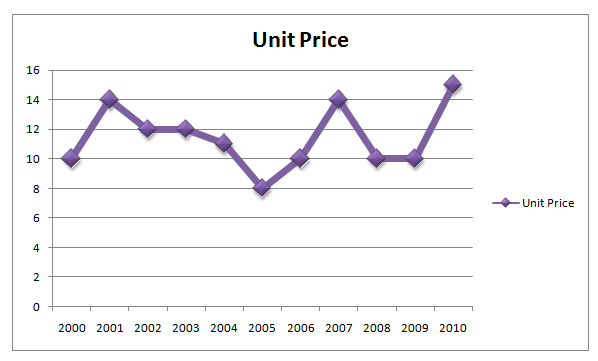


- In which year per unit cost is lowest?
A. 2002
B. 2003
C. 2006
D. 2007
Answer & Explanation
Answer – C. 2006
Explanation :
In the years 2002, 2003, 2006,2007
[table]Unit(x) = Total Revenue/Price Profit Cost Price=Revenue-Profit Cost Per Unit = Cost Price/ Unit x=1200/12=> x=100 300 1200-300 =900 900/100 =9 x=900/12=> x=75 150 900-150 =750 750/75=10 x=200/10=> x=20 100 200-100=100 100/20=5 x=700/14=> x=50 200 700-200=500 500/50=10 [/table]
- In which year per unit cost is highest?
A. 2001
B. 2005
C. 2006
D. 2007
Answer & Explanation
Answer – A. 2001
Explanation :
In the years 2001, 2005, 2006,2007
[table]Unit(x) = Total Revenue/Price Profit Cost Price=Revenue-Profit Cost Per Unit = Cost Price/ Unit x=1400/14=> x=100 100 1400-100 =1300 1300/100 =13 x=900/12=> x=75 150 900-150 =750 750/75=10 x=200/10=> x=20 100 200-100=100 100/20=5 x=700/14=> x=50 200 700-200=500 500/50=10 [/table]
- What is the approximate average quantity sold during the period 2000-2010?
A. 50%
B. 60%
C. 81%
D. 70%
Answer & Explanation
Answer – D. 70%
Explanation :
[table]Years Unit Price Revenue Total Units = Revenue/Unit Price 2000 10 700 70 2001 14 1400 100 2002 12 1200 100 2003 12 900 75 2004 11 1100 100 2005 8 400 50 2006 10 200 20 2007 14 700 50 2008 10 600 60 2009 10 800 80 2010 15 900 60 Total = 765-> Avg =756/11 =70(approx) [/table]
- What is the average number of total units sold in the years of 2002,2003,2004,2005 and 2008 together?
A. 88
B. 66
C. 77
D. 44
Answer & Explanation
Answer – C. 77
Explanation :
Average of total units sold in the years of 2002,2003,2004,2005 and 2008 = 100+75+100+50+60/5 =77 - If the price per unit decrease by 10% during 2000-2004 and cost per unit increase by 10% during 2005-2010, then the cumulative profit for the entire period 2000-2010 decrease by?
A. 700
B. 500
C. 565
D. 775
Answer & Explanation
Answer – D. 775
Explanation :
Total decrease in revenue = 10% of (700+1400+1200+900+1100) = 530
Total decrease in cost = 10% of (250+100+500+600+400+600) = 245
The cumulative profit for the entire period 2000-2010 decrease by = Total decrease in revenue + Total increase in cost = 530+245 = 775
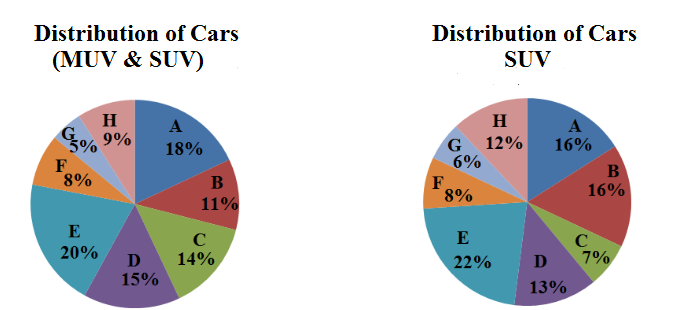
II. Refer to Pie Charts and answer the following questions:
Given Data:
Total number of cars (both MUV & SUV) distributed by 8 dealers in 2004 = 56000
Total number of SUV cars distributed by 8 dealers in 2004 = 32000

- Total number of MUV cars sold by dealers C and H together is by what % less than total number of cars(both SUV and MUV) sold by stores F and H together?
A. 27.58%
B. 25.58%
C. 26.58%
D. 28.57%
Answer & Explanation
Answer – D. 28.57%
Explanation :
Total no of MUV cars(C & H) = Total no of cars in MUV & SUV(C & H) – Total no of cars in SUV(C & H)
=(14% + 9%) of 56000 – (7% + 12%) of 32000 = 6800
Total number of cars(both SUV and MUV) sold by stores F and H together = (8% + 9%) of 56000 = 9520
% = [(9520 – 6800)/9520]*100 = 28.57%
- The number of cars( MUV and SUV) sold by store D is by what % more than total number of SUV cars distributed by dealers C, F and G together?
A. 50%
B. 25%
C. 75%
D. 605
Answer & Explanation
Answer – B. 25%
Explanation :
Number of cars in MUV & SUV for D = 15% of 56000 = 8400
Total no of SUV cars(C,F,G)= 21% of 32000=6720
% = [(8400- 6720)/6720)]*100= 25%
- What is the average number of MUV cars delivered by dealers A, D, E, F and H together?
A. 2892
B. 3354
C. 3634
D. 3296
Answer & Explanation
Answer – D. 3296
Explanation :
Total no of MUV cars(A,D,E,F,H) = Total no of cars in MUV & SUV(A,D,E,F,H) – Total no of cars in SUV(A,D,E,F,H)
Total no of MUV cars(A,D,E,F,H) = 70% of 56000 – 71% of 32000 =16480 => Average = 16480/5 =3296
- What is the respective ratio between total no of SUV cars distributed by dealers A and B together and total number of cars(MUV and SUV) delivered by stores C and F together?
A. 64:77
B. 64:79
C. 54:77
D. 64:73
Answer & Explanation
Answer – A. 64:77
Explanation :
Total no of SUV cars (A & B) : Total no of cars(MUV & SUV)for C & F
32% of 32000 : 22% of 56000
10240 : 12320 = 64:77
- If the number of cars distributed by stores A, D and E increased by 10%, 35% and 15% respectively from 2004-2005, what was the total number of MUV cars distributed by these three dealers in 2005?
A. 14964
B. 15964
C. 13964
D. 12964
Answer & Explanation
Answer – B. 15964
Explanation :
In 2005, number of cars (MUV & SUV) for A, D, E = [ 110% of 18% of 56000 + 135% of 15% of 56000 + 115% of 20% of 56000] = 35308
In 2005, number of cars SUV for A, D, E = [ 110% of 16% of 32000 + 135% of 13% of 32000 + 115% of 22% of 30000] = 19344
Total number of MUV cars distributed by these three dealers in 2005 = 35308 – 19344 =15964
AffairsCloud Recommends Oliveboard Mock Test
AffairsCloud Ebook - Support Us to Grow
Govt Jobs by Category
Bank Jobs Notification


