


Hello Aspirants. Welcome to Online Quantitative Aptitude section in AffairsCloud.com. Here we are creating question sample From Data Intrepretation that is important for all the competitive exams. We have included Some questions that are repeatedly asked in exams !!
Questions Penned by Yogit
Q(1 –5): Study the following pie charts and answer the following questions:
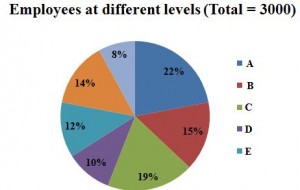
Details of 3000 employees working at different level in the organisatio
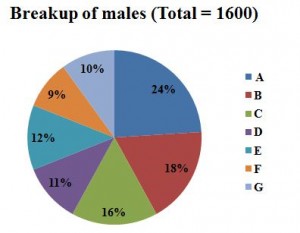
Breakup of 1600 male employees in the organisation


- How many females are working at level C?
a) 284
b) 304
c) 314
d) 324
e) None of these
Answer & Explanation
Answer – c) 314
Explanation :
Total working at level C = 3000*19/100 = 570
males working at level C = 1600*16/100 = 256
so females working at level C = 570 – 256 = 314
- What is the ratio of males to females working at level F?
a) 23:12
b) 12:27
c) 12:23
d) 23:27
e) None of these
Answer & Explanation
Answer – c) 12:23
Explanation :
Total employees at level F = 3000*14/100 = 420
males = 1600*9/100 = 144
females = 420 – 144 = 276
ratio = 144/276 = 12/23
- What is the total number of females working at level D and E together?
a) 282
b) 292
c) 312
d) 392
e) None of these
Answer & Explanation
Answer – b) 292
Explanation :
Females in D = 3000*10/100 – 1600*11/100 = 124
Females in E = 3000*12/100 – 1600*12/100 = 168
Total = 292
- What is the ratio of female employees working at level D to that of male employees at level G?
a) 31:40
b) 33:40
c) 40:31
d) 33:41
e) None of these
Answer & Explanation
Answer – a) 31:40
Explanation :
Females at level D = 3000*10/100 – 1600*11/100 = 124
males at level G = 1600*10/100 = 160
ratio = 124:160 = 31:40 - The number of males employees working in E, F and G level together forms what percent of the total number of employees?
a) 15.53%
b) 16.53%
c) 17.53%
d) 18.53%
e) None of these
Answer & Explanation
Answer – b) 16.53%
Explanation :
Males in E F and G level are = 1600*31/100 = 31*16
percentage w.r.t total employees = (31*16)*100/3000 = 16.53%
Q(6 –10) Study the following charts carefully and answer the following questions:
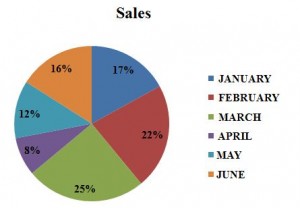
Percentage wise distribution of number of cars sold by company P and Q during six months. Total cars sold = 90000
Ratio between the numbers of cars sold by company P and Q during six months: –

| Month | Ratio |
| JANUARY | 8:7 |
| FEBRUARY | 4:5 |
| MARCH | 3:2 |
| APRIL | 7:5 |
| MAY | 7:8 |
| JUNE | 7:9 |
- What is the ratio of the number of cars sold by company Q during January to those sold during June by the same company?
a) 119:125
b) 119:135
c) 119:145
d) 119:120
e) None of these
Answer & Explanation
Answer – b) 119:135Explanation :
Ratio – (17/100)*90000*(7/15) : (16/100)*90000*9/16 = 119:135
- If 40% of the cars sold by company Q during May were sold at discount, then how many car sold by same company during May with no discount?
a) 4456
b) 3456
c) 3476
d) 3356
e) None of these
Answer & Explanation
Answer – b) 3456
Explanation :
Car sold without discount = (12/100)*90000*(8/15)*(60/100) = 3456
- The number of cars sold by company P during January is what percent of the number of car sold by company P during June?
a) 126%
b) 129%
c) 132%
d) 139%
e) None of these
Answer & Explanation
Answer – b) 129%
Explanation :
car sold in January = (17/100)*90000*8/15
car sold in june = (16/100)*90000*7/16
percentage = [(17*8)/(15*7)]*100 = 129% (approx.)
- If the company earn a profit of rupees 500 on each car sold by company P during April, then what was his total profit in April?
a) 19,00,000
b) 21,00,000
c) 23,00,000
d) 25,00,000
e) None of these
Answer & Explanation
Answer – b) 21,00,000
Explanation :
Total profit = 90000*(8/12)*(7/12)*500 = 21,00,000
- What is the total number of car sold by company Q during March and June together?
a) 16100
b) 15100
c) 12100
d) 17100
e) None of these
Answer & Explanation
Answer – d) 17100
Explanation :
In March = (25/100)*90000*2/5 = 9000
In June = (16/100)*90000*9/16 = 8100
Total = 17100
Note: Dear Readers if you have any doubt in any chapter in Quants you can ask here. We will clear your doubts


