


Hello readers, we’ve already provided the complete overview of Union Budget 2020-2021, now here comes the another important topic for upcoming examinations i.e. Economic Survey 2019-20 which was presented one day prior to the Union Budget 2020-2021. We urge you to read each and every point of the National Democratic Alliance (NDA) government’s economic survey.

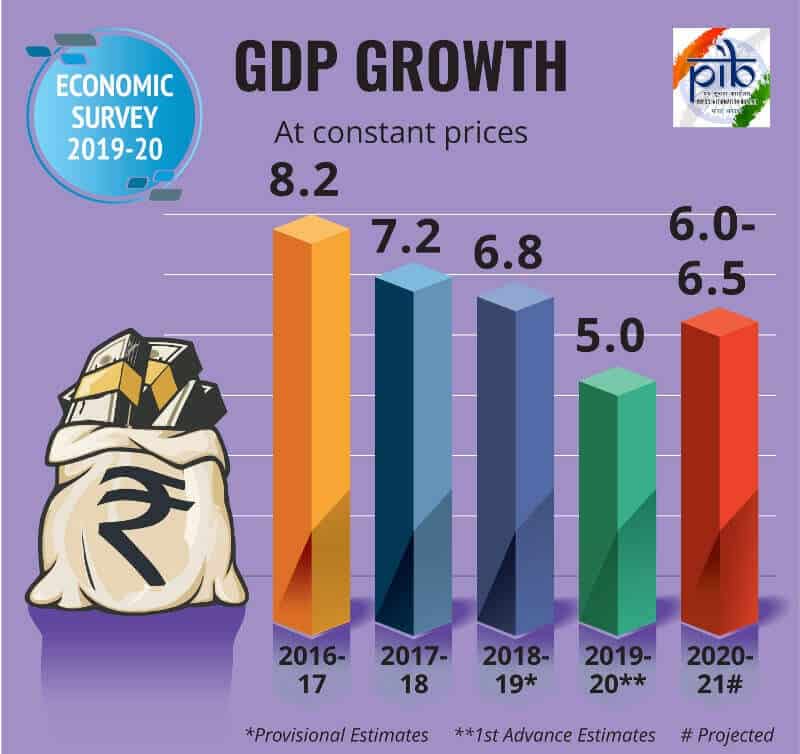
On 31st January 2020, Union Minister for Finance & Corporate Affairs, Smt. Nirmala Sitharaman presented the Economic Survey 2019-20 in the Parliament predicting India’s GDP (Gross Domestic Product) to be 6-6.5% in 2020-2021. This economic survey influenced by Kautilya’s Arthashashtra, has presented the “Thalinomics”– an attempt to relate economics to the common person using something that he or she encounters every day – a plate of food i.e. a Thali. As per survey,the affordability of a vegetarian thali improved by 29% between 2006-07 and 2019-20 and that of a non-vegetarian thali by 18% over the 13-year period.
- The Overarching theme of Economic Survey 2019-20 is Wealth Creation. The survey documents ideas of wealth creation that are rooted in India’s tradition from Arthashashtra to Thiruvalluvar’s Thirukural.
- The aim of the survey is to make India USD 5 trillion economy by 2025.
Point to be noted: Arthashashtra, written by Kautilya is a treatise on economic policy, statecraft and military strategy. The treatise is estimated to have been completed around the 2nd century BCE (Before Common Era).

Who has prepared the economic survey 2019-20?
The Economic Survey, which is a detailed report card on the Centre’s economic performance through the year and future projection on the country’s growth has been prepared by the Economic Division, Department of Economic Affairs, Ministry of Finance under the guidance of Chief Economic Adviser, Ministry of Finance, Krishnamurthy V. Subramanian in a period of 6 months. It is a collaborative effort of all Ministries and Departments of Government of India including researchers, consultants and think tanks both within and outside the government. The Economic Survey 2019-20 has also sourced certain data from Wikipedia, which is not considered as reliable source of information.
Now, let’s go through the very points of Economic Survey 2019-2020.
- Golden jubilee of bank nationalisation Survey observes 2019 as the golden jubilee year of bank nationalization.
- India has only one bank in the global top 100 i.e State Bank of India which is also on lowly 55th rank. Being the fifth largest economy, India should have at least six banks in the top 100 global list, and at least eight would be required for a country having a $5-trillion economy.
- India ranked third in number of new firms created, as per the World Bank:
- New firm creation in India increased dramatically since 2014
- 2 % cumulative annual growth rate of new firms in the formal sector during 2014-18, compared to 3.8 % during 2006-2014.
- About 1.24 lakh new firms created in 2018, an increase of about 80 % from about 70,000 in 2014.
- New firm formation is the lowest in eastern India with the lowest literacy rate (59.6 % as per 2011 Census).
- The survey suggests creating of job on Chinese model.’Assemble in India for the world’ strategy with Make in India. Apart from raising India’s share in world trade, it could give India 8 crore well-paying jobs by 2030
- A 10 percent increase in registration of new firms in a district yields a 1.8 % increase in Gross Domestic District Product (GDDP).
i.Fiscal Deficit: In 2019-20, Centre’s fiscal deficit was budgeted at Rs. 7.04 lakh crore (3.3% of GDP), as compared to Rs. 6.49 lakh crore (3.4% of GDP) in 2018-19.
ii.CAD: Current Account Deficit (CAD) narrowed to 1.5 % of GDP in H1 of 2019-20 from 2.1 % in 2018-19
iii.Infrastructure Investment: To achieve GDP of USD 5 trillion by 2024 – 2025, India needs to spend about USD 1.4 trillion (Rs.100 lakh crore) over these years on infrastructure so that lack of infrastructure does not become a constraint to the growth of Indian economy. In this regard Infrastructure Investment of Rs.102 Lakh Crore is budgeted for FY 2020-2025.
iv.India’s GDP growth moderated to 4.8% in H1 (First Half) of 2019-20. The survey showed 5 % GDP growth for 2019-20 based on CSO’s (Central Statistics Office) first Advance Estimates.
v.The industrial growth for the current year has been listed as 2.9% while the agricultural growth is 2.8%.
vi.India’s forex reserves reach a historic level of $450 billion dollars.
vii.India has become 2nd Largest Emerging Green Bond Market after China. The State Bank of India(SBI) entered the market with an US$650 million Certified Climate Bond. India also joined the International Platform on Sustainable Finance (IPSF) in 2019 to scale up the environmentally sustainable investments.
viii.The bollywood movie Band Baaja Baaraat was given reference to show Indian entrepreneurship.
ix.Decline in inflation: Declining inflation from 3.2% in April 2019 to 2.6% in December 2019, reflecting weakening demand pressure in the economy.
x.GST Collections: GST collections grew by 4.1% for the centre during April-November 2019. Gross GST monthly collections have crossed the mark of Rs. 1 lakh crore for a total of five times during 2019-20.
xi.BoP (Balance of Payments)– India’s BoP’s position improved from US$ 412.9 bn of forex reserves at the end March, 2019 to US$ 433.7 bn at the end September, 2019.
xii.Foreign reserves stood at US$ 461.2 bn as on 10th January, 2020.
xiii.In sync with an estimated 2.9% growth in global output in 2019, global trade is estimated to grow at 1.0% after having peaked in 2017 at 5.7%. However, it is projected to recover to 2.9% in 2020 with recovery in global economic activity.
xiv.India’s merchandise trade balance improved from 2009-14 to 2014-19, although most of the improvement in the latter period was due to more than 50% decline in crude prices in 2016-17.
xv.India’s top five trading partners continue to be USA (United States of America), China, UAE (United Arab Emirates), Saudi Arabia and Hong Kong.
xvi.Exports– Top export items are Petroleum products, precious stones, drug formulations & biologicals, gold and other precious metals. Largest export destinations in 2019-20 (April-November): United States of America (USA), followed by United Arab Emirates (UAE), China and Hong Kong.
xvii.Imports-Top import items are Crude petroleum, gold, petroleum products, coal, coke & briquittes. India’s imports continue to be largest from China, followed by USA, UAE and Saudi Arabia.
xviii.Under trade facilitation, India improved its ranking from 143 in 2016 to 68 in 2019 under the indicator, “Trading across Borders”, monitored by World Bank in its Ease of Doing Business Report.
xix.Logistics industry of India: Currently estimated to be around US$ 160 billion it is expected to touch US$ 215 billion by 2020. According to World Bank’s Logistics Performance Index, India ranks 44th in 2018 globally, up from 54th rank in 2014.
xx.External debt: Remains low at 20.1% of GDP as at end September, 2019.
Other Important Highlights:
–Metro facility: The metro facility in India has been expanded to 18 cities. So far, 670 km Metro lines have been commissioned and work is on to expand it to 930 km.
–Medical colleges: This year, 75 new medical colleges have been approved in the country. This will increase the total number to 16,000 MBBS medical and over 4,000 PG seats
–PM-KISAN: Under Prime Minister Kisan Samman Nidhi, more than Rs 43,000 crore has been deposited in the bank account of over 8 crore farmer familie
–Agreement with Bodo Organizations: The Central and Assam Governments have recently signed a historic agreement with the Bodo Organizations to bring an end to the 5 decade-old Bodo dispute
–Increase in houses completion under PMAY-G: The two Schemes, Pradhan Mantri Awaas Yojana- Gramin (PMAY-G) and Pradhan Mantri Awaas Yojana- Urban (PMAY-U), seek to achieve the target of housing for all by 2022. Under PMAY-G, the number of houses completed in a year increased by more than four times, from 11.95 lakh in 2014-15 to 47.33 lakh in 2018-19,
– Creation of jobs: 2.6 crore jobs created in Rural and Urban Areas Between 2011-12 and 2017-18
- The share of regular wage/salaried employees has increased by 5 percentage points from 18 per cent in 2011-12 to 23 per cent in 2017-18.
- In absolute terms, there was a significant jump of around 2.62 crore new jobs with 1.21 crore in rural areas and 1.39 crore in urban areas in this category.
- 8% increase in regular employment of women in 2017-18 over 2011-12.
–Open Defecation Free: All Urban areas of 35 States/UTs have become ODF and percentage of waste processing rose from around 18 percent to 60 percent.
–Services Sector: It accounted for about 55% of the economy and Gross Value Added (GVA) growth, two-thirds of total FDI inflows into India and about 38% of the total exports. The sector’s share now exceeds 50$ of the Gross State Value Added (GSVA) in 15 out of the 33 states and UT.
–Improvement in Space Sector: India’s space programme has grown exponentially since its modest beginnings five decades ago, moving from simple mapping services to many more uses currently. Even though India’s spending is less compared to others, ISRO has launched around 5-7 satellites per year in recent years with almost no failures.
–Foreign Direct Investment (FDI): Net FDI inflows in 2019-20 attracting US$ 24.4 bn in the first eight months, higher than the corresponding period of 2018-19.
- Net Foreign Portfolio Investment (FPI) in the first eight months of 2019-20 stood at US$ 12.6 bn.
- Net remittances from Indians employed overseas increased to US$ 38.4 billion in H1 of 2019-20 which is more than 50% of the previous year level.
- Services Sector sees 33% Jump in Gross FDI
Monetary Management and Financial Intermediation
- Repo rate was cut by 110 basis points in four consecutive Monetary Policy Committee (MPC) meetings in the financial year due to slower growth and lower inflation.
- The Gross Non Performing Advances ratio remained unchanged for Scheduled Commercial banks (SCBs) at 9.3% between March and September 2019 but increased slightly for the Non-Banking Financial Corporations (NBFCs) from 6.1% in March 2019 to 6.3% in September 2019.
- Bank Credit growth (YoY-Year Over Year) moderated from 12.9% in April 2019 to 7.1% as on December 20, 2019.
- Capital to Risk-weighted Asset Ratio of SCBs increased from 14.3% to 15.1% between March 2019 and September 2019.
Prices and Inflation
- Inflation witnessing moderation since 2014
- Consumer Price Index (CPI) inflation increased from 3.7% in 2018-19 (April to December, 2018) to 4.1% in 2019-20 (April to December, 2019).
- Wholesale Price Index (WPI) inflation fell from 4.7% in 2018-19 (April to December, 2018) to 1.5% during 2019-20 (April to December, 2019).
- During 2019-20 (April-December), food and beverages was the main contributor. Among them, inflation in vegetables and pulses was particularly high due to low base effect and production side disruptions like untimely rain.
- CPI – Combined (C) inflation has been highly variable across States ranging between (-)0.04% to 8.1% across States/UTs in financial year (FY) 2019-20 (April-December).
Sustainable Development and Climate Change
- SDG (Sustainable Development Goals) India Index 2019: Himachal Pradesh, Kerala, Tamil Nadu, Chandigarh are front runners. While Assam, Bihar and Uttar Pradesh are under the category of Aspirants.
- New Delhi, India hosted COP-14 (14th Conference of Parties) of UNCCD (United Nations Convention to Combat Desertification) which adopted the Delhi Declaration: Investing in Land and Unlocking Opportunities.
- During COP-25 of UNFCCC at Madrid, Spain India reiterated its commitment to implement the Paris Agreement.
- Increase in forest cover: The forest and tree cover have reached 80.73 million hectares which is 24.56% of the geographical area of the country.
- States/UTs showing gain in forest cover are Karnataka (1,025 sq. km), Andhra Pradesh (990 sq. km) and Jammu & Kashmir (371 sq. km).
- States showing loss in forest cover include Manipur, Meghalaya, Arunachal Pradesh and Mizoram.
- International Solar Alliance (ISA): It has been institutionalized 30 Fellowships from the Member countries. Facilitators got the lines of credit worth US$ 2 Billion from EXIM Bank of India and 1.5 Billion from AfD, France.
- In the Forest Report 2019, the total carbon stock in forest is estimated as 7,124.6 million tons, showing an increase of 42.6 million tons as compared to the last assessment in 2017.
Growth in fisheries and livestock sector to aid in doubling farmer’s income :Economic Survey
Fisheries Sector:
Economic Survey further states that fisheries remain an important source of food, nutrition, employment and income in India. It has been showing a steady growth in the total GVA and accounts for 6.58 per cent of GDP from agriculture, forestry and fishing
- The sector has been one of the major contributors of foreign exchange earnings with India being one of the leading seafood exporting nations in the world. The Economic Survey stated that during 2018-19, export of marine products stood at 13.92 lakh tonnes and valued at Rs 46,589 crore with USA and South East Asia the major export markets for Indian seafood with a share of 34.81 per cent and 22.67 per cent respectively.
- The Economic Survey says that under the Rs 7,522.48 crore Fisheries and Aquaculture Infrastructure Development Fund (FIDF) created by the government in 2018-19 to address the gaps in fisheries infrastructure, proposals to the tune of Rs 2751.33 crore have been received from the various states and other eligible entities. Proposals to the tune of Rs 1715.04 crores have been recommended and rest are under process.
- The total fish production in the country stood at 13.42 million tonnes (provisional) during 2018-19. Of this, the marine fisheries contributed 3.71 million tonnes and the inland fisheries contributed 9.71 million tonnes.
- As per the Economic Survey 2020 Andhra Pradesh with 34,49,560 tonnes (28,44,610 tonnes of inland fish and 6,04,950 tonnes of marine fish) of fish production in 2017-18 fiscal topped the chart. West Bengal became second with 17,42,090 tonnes of fish production, Gujarat with the largest coastline in the country, stood third followed by Odisha and Tamil Nadu
Livestock sector and Others:
livestock sector growing at a compound annual growth rate of nearly 8 per cent over the last five years, It has become an important secondary source of income for millions of rural families and plays an important role in achieving the goal of doubling farmers’ income.
Further, India continues to be the largest producer of milk in the world. Milk production in the country was 187.7 million tonnes in 2018-19 and registered a growth rate of 6.5 per cent over the previous year . The per capita availability of milk has reached a level of 394 grams per day during 2018-19. Egg production in the country, which was 95,217 million numbers in 2017-18, increased to 103318 million numbers in 2018-19, the survey says.
Agriculture and Food Management
- Gross Value Added (GVA) at Basic Prices for 2019-20 from ‘Agriculture, Forestry and Fishing’ sector is estimated to grow by 2.8 %.
- Agricultural productivity is also constrained by a lower level of mechanization in agriculture which is about 40% in India, much lower than China (59.5 %) and Brazil(75 %).
- Livestock sector has been growing at a Compound annual growth rate (CAGR) of 9 % during the last five years, which is playing an important role in achieving the goal of doubling farmers’ income.
- During the last 6 years ending 2017-18, Food Processing Industries sector has been growing at Average Annual Growth Rate (AAGR) of around 5.06 %
Industry and Infrastructure
- The industrial sector as per Index of Industrial Production (IIP) registered a growth of 0.6% in 2019-20 (April-November) as compared to 5.0 % during 2018-19 (April-November).
- Fertilizer sector achieved a growth of 4.0 % during 2019-20 (April-November) as compared to (-) 1.3 per cent during 2018-19 (April-November).
- Steel sector achieved a growth of 5.2 % during 2019-20 (April-November) as compared to 3.6 % during 2018-19 (April-November).
- Total telephone connections in India touched 119.43 crore as on September 30, 2019.
- The installed capacity of power generation has increased to 3, 64,960 MW as on October 31, 2019 from 3, 56,100 MW as on March 31, 2019.
Social Infrastructure, Employment and Human Development
- The expenditure on social services (health, education and others) by the Centre and States as a proportion of GDP increased from 6.2 % in 2014-15 to 7.7 % in 2019-20 (BE).
- India’s ranking in Human Development Index (HDI) improved to 129 in 2018 from 130 in 2017. With 1.34 % average annual HDI growth, India is among the fastest improving countries.
- Around 60 % of the productive age (15-59) group engaged in full time domestic duties.
- Mission Indradhanush has vaccinated 3.39 crore children and 87.18 lakh pregnant women of 680 districts across the country.
- About 76.7 % of the households in the rural areas and about 96 % in the urban areas had houses of pucca structure.
- A 10 Year Rural Sanitation Strategy (2019-2029) launched to focus on sustaining the sanitation behavior change and increasing access to solid and liquid waste management.
Creating Jobs and Growth by Specializing in Network Products
- To raise export market share to about 5 % by 2025 and 6 % by 2030.
- To Create 4 crore well-paid jobs by 2025 and 8 crore by 2030.
- India’s exports increased by 13.4 % for manufactured products and 10.9 % for total merchandise.
- Imports increased by 12.7% for manufactured products and 8.6% for total merchandise.
- India gained 0.7 % increase in trade surplus per year for manufactured products and 2.3 % per year for total merchandise.
Targeting Ease of Doing Business in India
- A jump of 79 positions to 63 in 2019 from 142 in 2014 in World Bank’s Doing Business rankings.
- The turnaround time of ships in India has almost halved to 48 days in 2018-19 from 4.67 days in 2010-11.
Privatization and Wealth Creation
Strategic disinvestment of Government’s shareholding of 53.29 per cent in Hindustan Petroleum Corporation Limited (HPCL) led to an increase of around Rs. 33,000 crore in national wealth.


