


Hello Aspirants.
Welcome to Online Quantitative Aptitude section in AffairsCloud.com. Here we are creating question sample From Data Interpretation that is important for all the competitive exams. We have included Some questions that are repeatedly asked in exams.
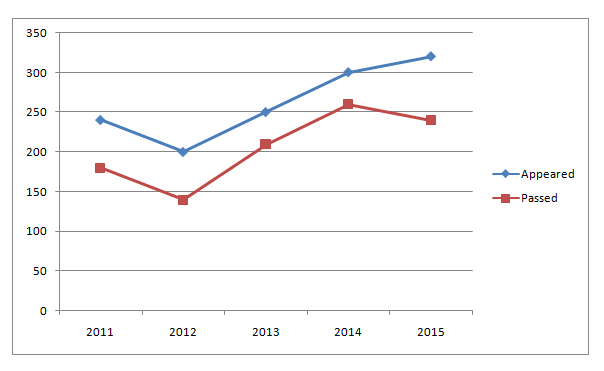
I. (Q.no: 1-5). Refer to the following Line Graph and answer the given questions.

| 2011 | 2012 | 2013 | 2014 | 2015 | |
|---|---|---|---|---|---|
| Appeared | 240 | 200 | 250 | 300 | 320 |
| Passed | 180 | 140 | 210 | 260 | 240 |
- The number of students who could pass the exam in the year 2016 were 10% more than that in the previous year. Only 75% of those who appeared in the year 2016 could pass the exam that year. How many students appeared for the exam in the year 2016?
A. 340
B. 336
C. 418
D. 420
E. 352
Answer & Explanation
Answer – E. 352
Explanation :
Number of students who could pass the exam in the year 2016 = 110% of 240 = 264
75% of x = 264
x = 264 * 100/75 = 352 - Number of students who had passed the exam in the year 2012 are what percent less than that in the year 2013?
A. 235/9 %
B. 25 %
C. 122/3 %
D. 100/3 %
E. 30 %
Answer & Explanation
Answer – D. 100/3 %
Explanation :
Required % = (70/210) * 100 = 100/3 % - What percent of students who appeared for the exam in the year 2011 could pass the exam?
A. 395/6 %
B. 212/3 %
C. 75 %
D. 60 %
E. 80 %
Answer & Explanation
Answer – C. 75%
Explanation :
% = 180/240 * 100 = 75% - What is the respective ratio of total number of students who appeared for the exam in the years 2014 and 2015 together and the total number of students who could pass the exam in the same years together?
A. 35:29
B. 31:25
C. 28:21
D. 33:25
E. 31:26
Answer & Explanation
Answer – B. 31:25
Explanation :
Total number of appeared candidates in the years 2014 and 2015 together = 620
Total number of passed candidates in the years 2014 and 2015 together = 520
= 620 : 500
= 31 : 25
- What is the average number of students who passed for the exam in all the years together?
A. 240
B. 206
C. 150
D. 250
E. 280
Answer & Explanation
Answer – B. 206
Explanation :
Average number of students who passed in all the years together =[180 + 140 + 210 + 260 +240]/5 = 206
II. (Q.no: 6-10). Refer to the following table and answer the given questions.
| Companies | Branches | Total number of Employees | Ratio of Male to Female Employees | Percentage of Post Graduate Employees |
|---|---|---|---|---|
| P | 16 | 2568 | 5 : 7 | 75% |
| Q | 18 | 2880 | 11 : 5 | 65% |
| R | 14 | 2310 | 10 : 11 | 40% |
| S | 22 | 3575 | 3 : 2 | 60% |
| T | 13 | 2054 | 7 : 6 | 50% |
| U | 17 | 2788 | 20 : 21 | 75% |
| V | 24 | 3720 | 8 : 7 | 55% |
| W | 21 | 3360 | 9 : 5 | 80% |
- If the number of male post graduate employees in company W is 1488, what percent of the female employees in that particular company are post graduate?
A. 75%
B. 100%
C. 74%
D. 73%
E. 72%
Answer & Explanation
Answer – B. 100%
Explanation :
Number of Females in Company W = 3360 *(5/14) = 1200
Number of Post graduate employees in Company W = 3360 *(80/100) = 2688
Number of female post graduate employees in Company W = 2688 – 1488 = 1200
Required Percentage = (1200 * 100)/1200 = 100% - In which of the given companies is the percentage of women employees with respect to the total number of employees(both males and females) in that company the third lowest?
A. V
B. W
C. P
D. Q
E. S
Answer & Explanation
Answer – E. S
Explanation :
Company P : ([7/12 * (2568)] / 2568)*100 = 58.33%
Company Q : ([5/16 * (2880)] / 2880)*100 = 31.25%
Company R : ([11/21 * (2310)] / 2310)*100 = 52.38%
Company S : ([2/5 * (3575)] / 3575)*100 = 40%
Company T : ([6/13 * (2054)] / 2054)*100 = 46.15%
Company U : ([21/41 * (2788)] / 2788)*100 = 51.21%
Company V : ([7/15 * (3720)] / 3720)*100 = 46.66%
Company W : ([5/14 * (3360)] / 3360)*100 = 35.71% - What is the ratio of the total number of male employees in companies Q and W together to the total number of female employees in Companies R and S together?
A. 63 : 51
B. 51 : 48
C. 77 : 63
D. 69 : 44
E. 55 : 53
Answer & Explanation
Answer – D. 69 : 44
Explanation :
= [2880 * (11/16)/ 2310 * (11/21) + 3360 * (9/14)/ 3575 * (2/5)]
= (1980 + 2160)/(1210 + 1430) = 414/264 = 69:44 - What is the sum of the average number of post graduate employees in companies P, Q and S together and the average number of post graduate employees in companies U, V and W?
A. 4272
B. 4312
C. 4256
D. 4346
E. 4289
Answer & Explanation
Answer – C. 4256
Explanation :
Average number of post graduate employees in companies P, Q and S = (1926 + 1872 + 2145)/3 = 5943/3 = 1981
Average number of post graduate employees in companies U, V and W = (2091 + 2046 + 2688)/3 = 6875/3 = 2275
Difference = 2275 + 1981 = 4256 - Which of the given companies has the second highest number of average employees per office?
A. Q
B. R
C. S
D. U
E. T
Answer & Explanation
Answer – D. U
Explanation :
Company P – 2568/16 = 160.5 ; Company Q – 2880/18 = 160
Company R – 2310/14 = 165 ; Company S – 3575/22 = 162.5
Company T – 2054/13 = 158 ; Company U – 2788/17 = 164
Company V – 3720/24 = 155 ; Company W – 3360/21 = 160
AffairsCloud Recommends Oliveboard Mock Test
AffairsCloud Ebook - Support Us to Grow
Govt Jobs by Category
Bank Jobs Notification


